





TL;DR: The workloads that justify real-time analytics keep rewriting the same rows. Agent traces get patched seconds after they're written, live dashboards change every second, and risk profiles update with every event. An engine that reconciles updates at read time pays for them on every query, while Apache Doris does that work at write time with Merge-on-Write. In our benchmark with every row updated, VeloDB ran up to 34x faster than ClickHouse, and a Contact Center serves 1,125 queries per second at 101 ms p95 while updates land on the same tables.
Read and write for Analytics have been decoupled with the Lakehouse era. However, with emerging agentic workloads, analytic databases now have to handle updates well too. Many applications depend on real-time analytics to deliver insights and decisions as data constantly changes while dashboards, applications, and AI agents read it.
A database handles updates well when it applies each change to an existing key as fast as the source sends it, and its queries run just as fast afterward. Most analytical engines were built for data that is written once and then only read, which is why update handling is often where a "real-time" system falls short in production.
Langfuse, an LLM observability company, ran into this directly. Each trace Langfuse stores is a row that gets patched after it's written, as the end time, output, token count, and evaluator scores come in, and 90% of those patches arrive within 10 seconds of the original event. Langfuse stored its traces in ClickHouse, so the team had to deduplicate on every read to return correct results. By March 2026, "scanning billions of records to surface only the latest version of each row... consumed lots of CPU and memory, and resulted in high API latencies." In the end, Langfuse redesigned its product so that it no longer updates rows. (Langfuse, Mar 2026; Langfuse, Dec 2024)
A team that changes its data model to avoid updates is working around a limit in its database.
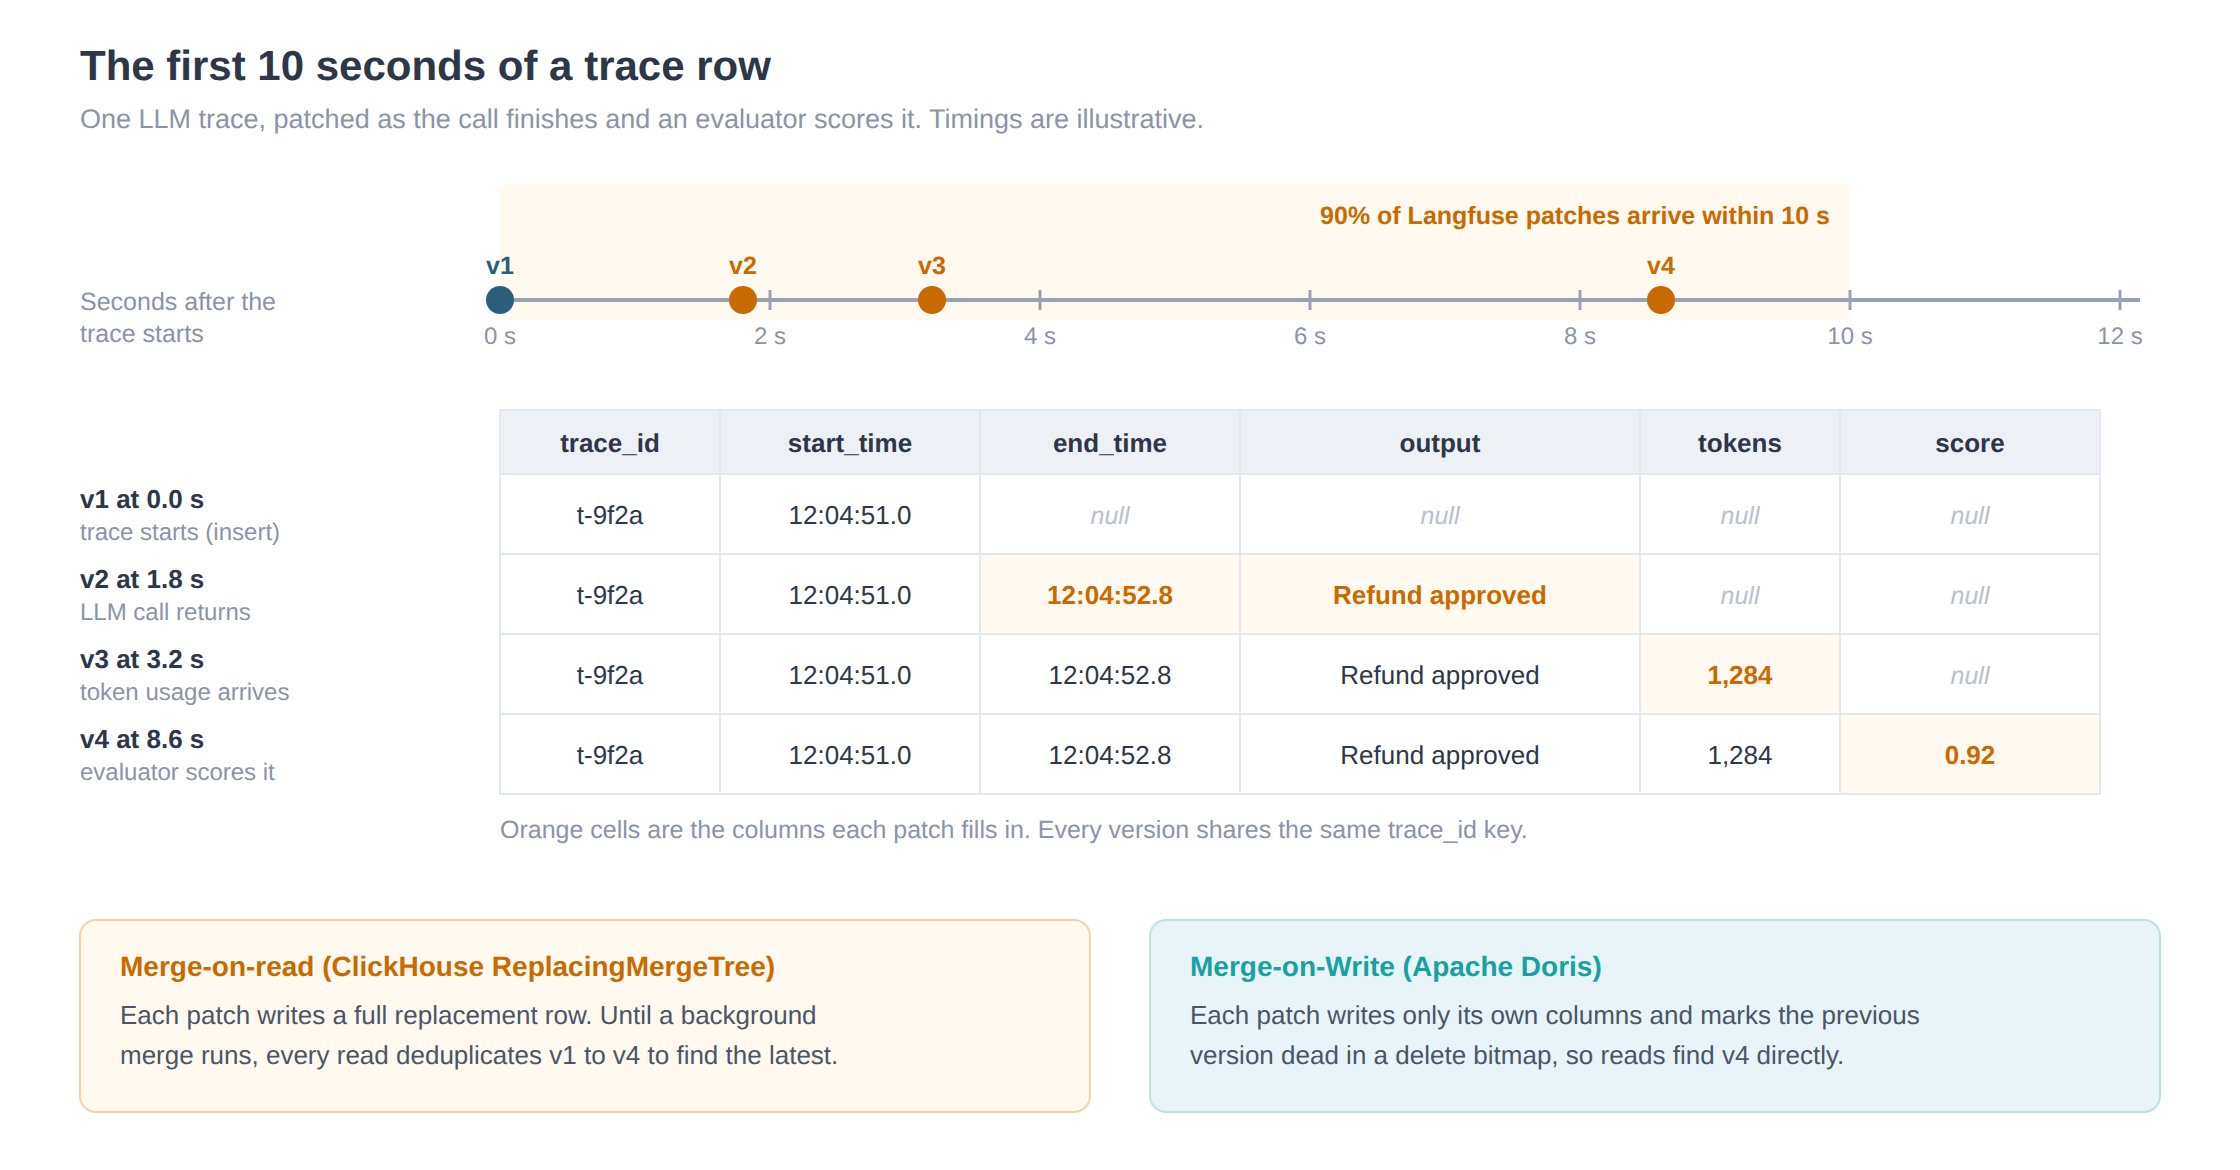
Figure 1. One trace row as its patches arrive. The timings are illustrative, and the 10-second window comes from Langfuse's published numbers.
Why do updates matter more now than five years ago?
Three things have changed since most analytical engines were designed.
-
AI agents and pipelines write back. In June 2026, Databricks described how agent memory works: "Agents write new learnings to memory on one turn, and need that exact data fully indexed and searchable on the next." Gartner expects agentic AI to make at least 15% of day-to-day work decisions autonomously by 2028, up from 0% in 2024. Each of those decisions reads a row and many of them write one, so the more work agents take on, the more updates reach the database. (Databricks; Gartner)
-
CDC from Postgres is the default feed. PostgreSQL is used by 55.6% of developers and accounts for 69.6% of Debezium CDC sources, and one in five Debezium users processes hundreds of thousands to millions of changes per minute. Each UPDATE and DELETE upstream reaches the analytics layer as an upsert or a tombstone, so the analytical database receives the same stream of changes as the operational one. (Stack Overflow 2025; Debezium 2026 survey)
-
Engines and table formats are adding write-time updates. A ClickHouse blog post on the history of the feature says "Column stores weren't supposed to have fast updates." ClickHouse shipped lightweight updates in version 25.7, and as of September 2026 its docs still say "Lightweight updates are currently beta," with the feature intended for updates of "up to about 10% of the table." Iceberg v3 replaced positional delete files with deletion vectors. In June 2025, Snowflake bought Crunchy Data and Databricks announced Lakebase, its Postgres service, nine days apart. Most of these changes rely on the same approach: mark the old row at write time so reads can skip it. (ClickHouse blog; ClickHouse docs; Iceberg spec)
For an analytical database, this means applying updates to existing keys as fast as the source produces them while keeping reads as fast as they were before the updates arrived.
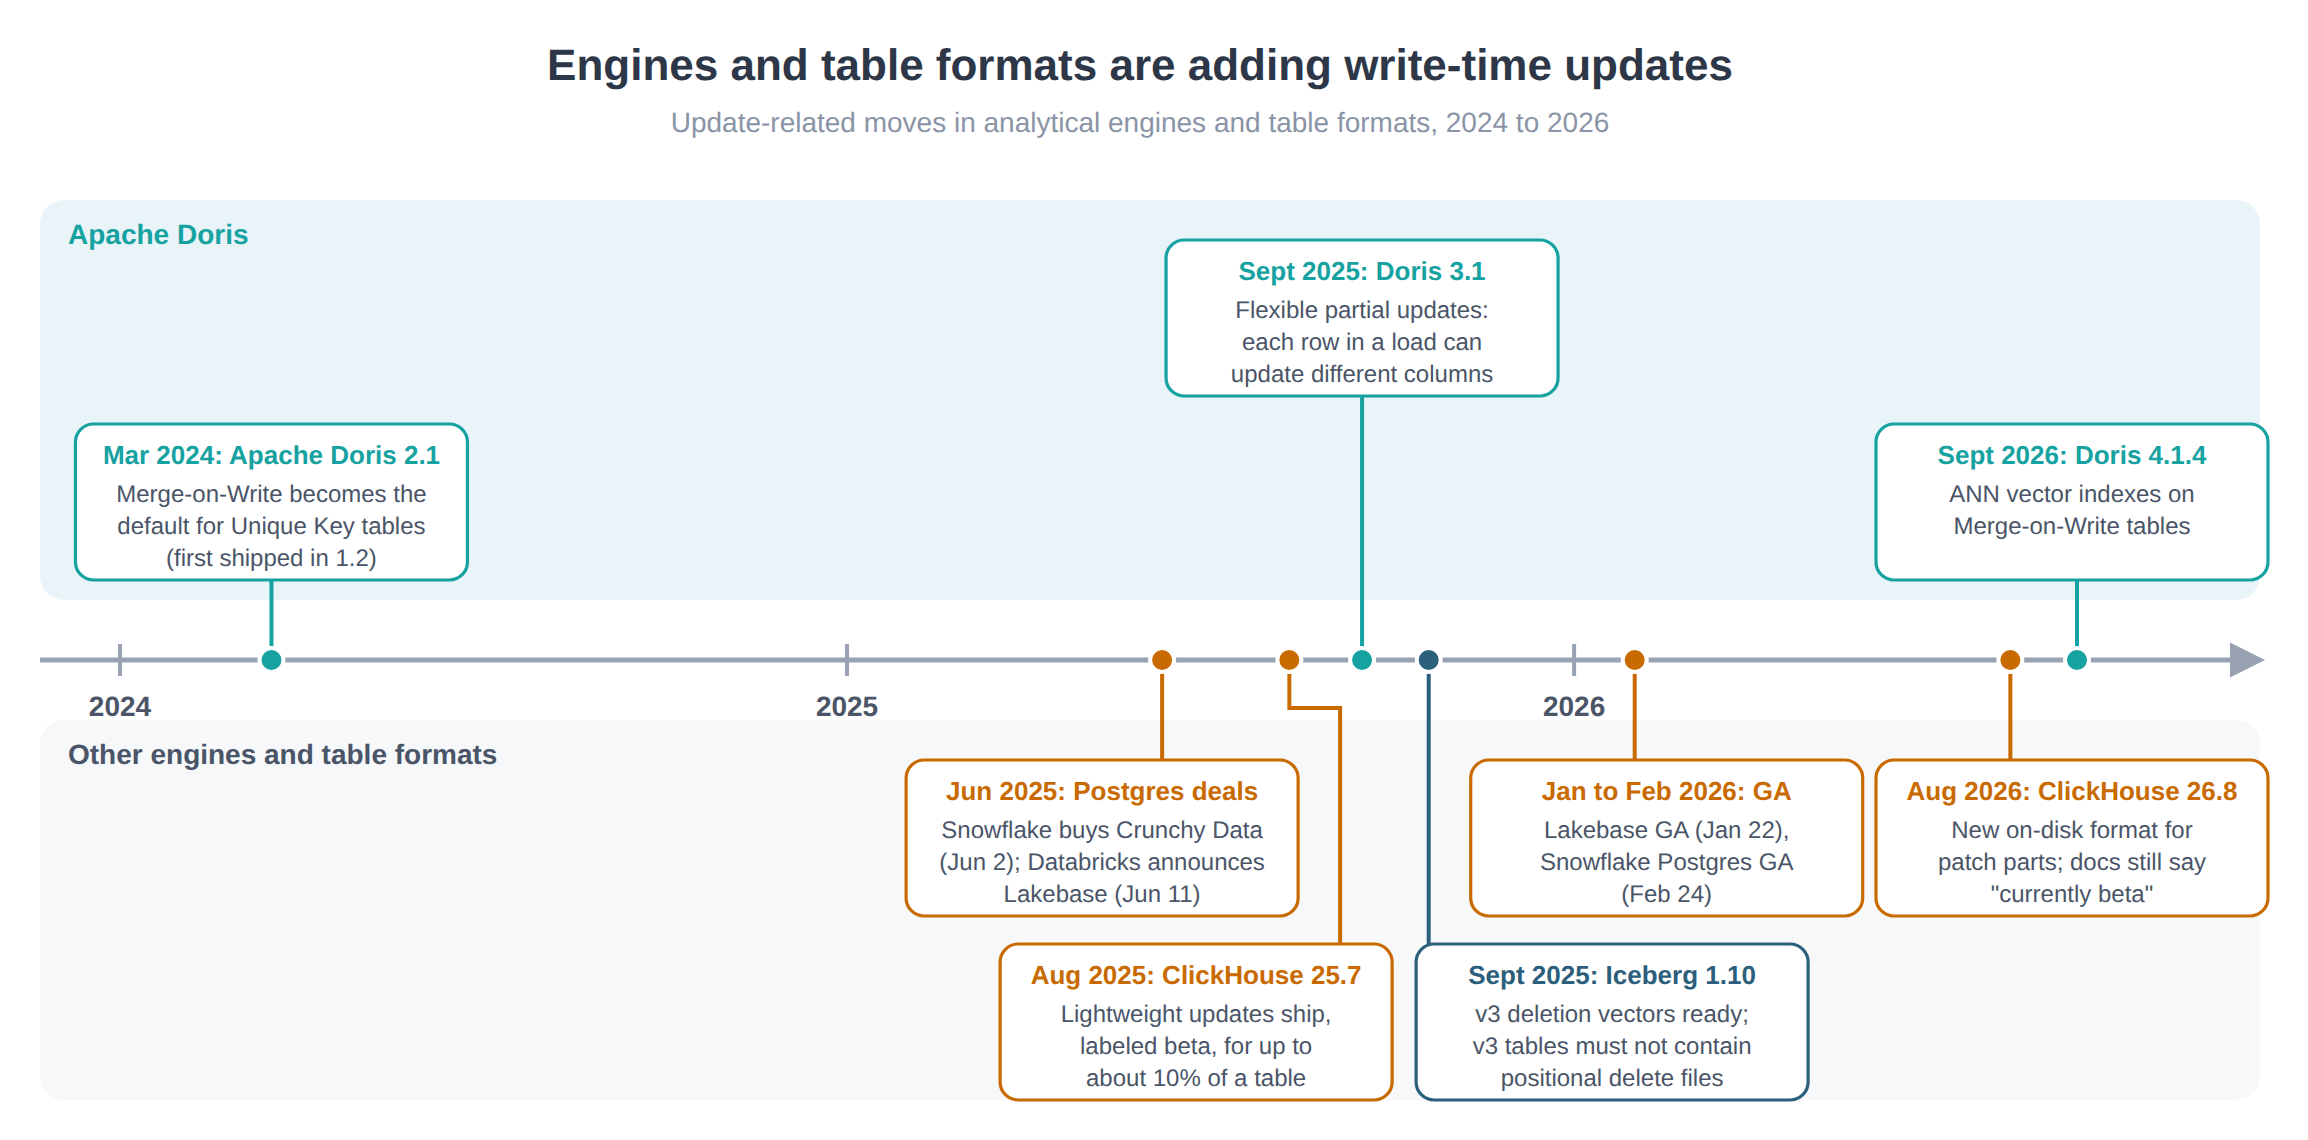
Figure 2. Update-related moves across analytical engines and table formats, 2024 to 2026. Sources are linked in the section above.
Which workloads define the need for fast updates?
The three workloads below all update rows constantly, but they differ in how the updates arrive and in who reads the results.
AI pipelines and agent traces
In an AI pipeline, a row might be a span, a social post, or a record that several AI services enrich. The row starts out incomplete, and each service patches a few columns when it finishes. Since the services run at different speeds, the patches often arrive in a different order than the services started.
Langfuse shows how quickly this grows. About 60% of their observations now arrive through the OpenTelemetry endpoint, and during 2025 their data grew 19x while their ClickHouse node sizes grew 15x. The write pattern made things harder, because ReplacingMergeTree required "writing full-row replacements rather than updating individual fields." ClickHouse's own case study on Langfuse describes what that costs on reads: "If you want to have very accurate data, you need to deduplicate whenever you read the data." (Langfuse engineering; ClickHouse)
Agents run into the same problem with their own memory. A June 2026 benchmark called Supersede found that the dominant memory failure in LLM agents is failing to overwrite facts that have been superseded, and GPT-5.4 accuracy dropped from 92% with full context to 77% when the agent maintained its own memory. Keeping agent memory correct depends on reliable upserts. (arXiv 2606.27472)
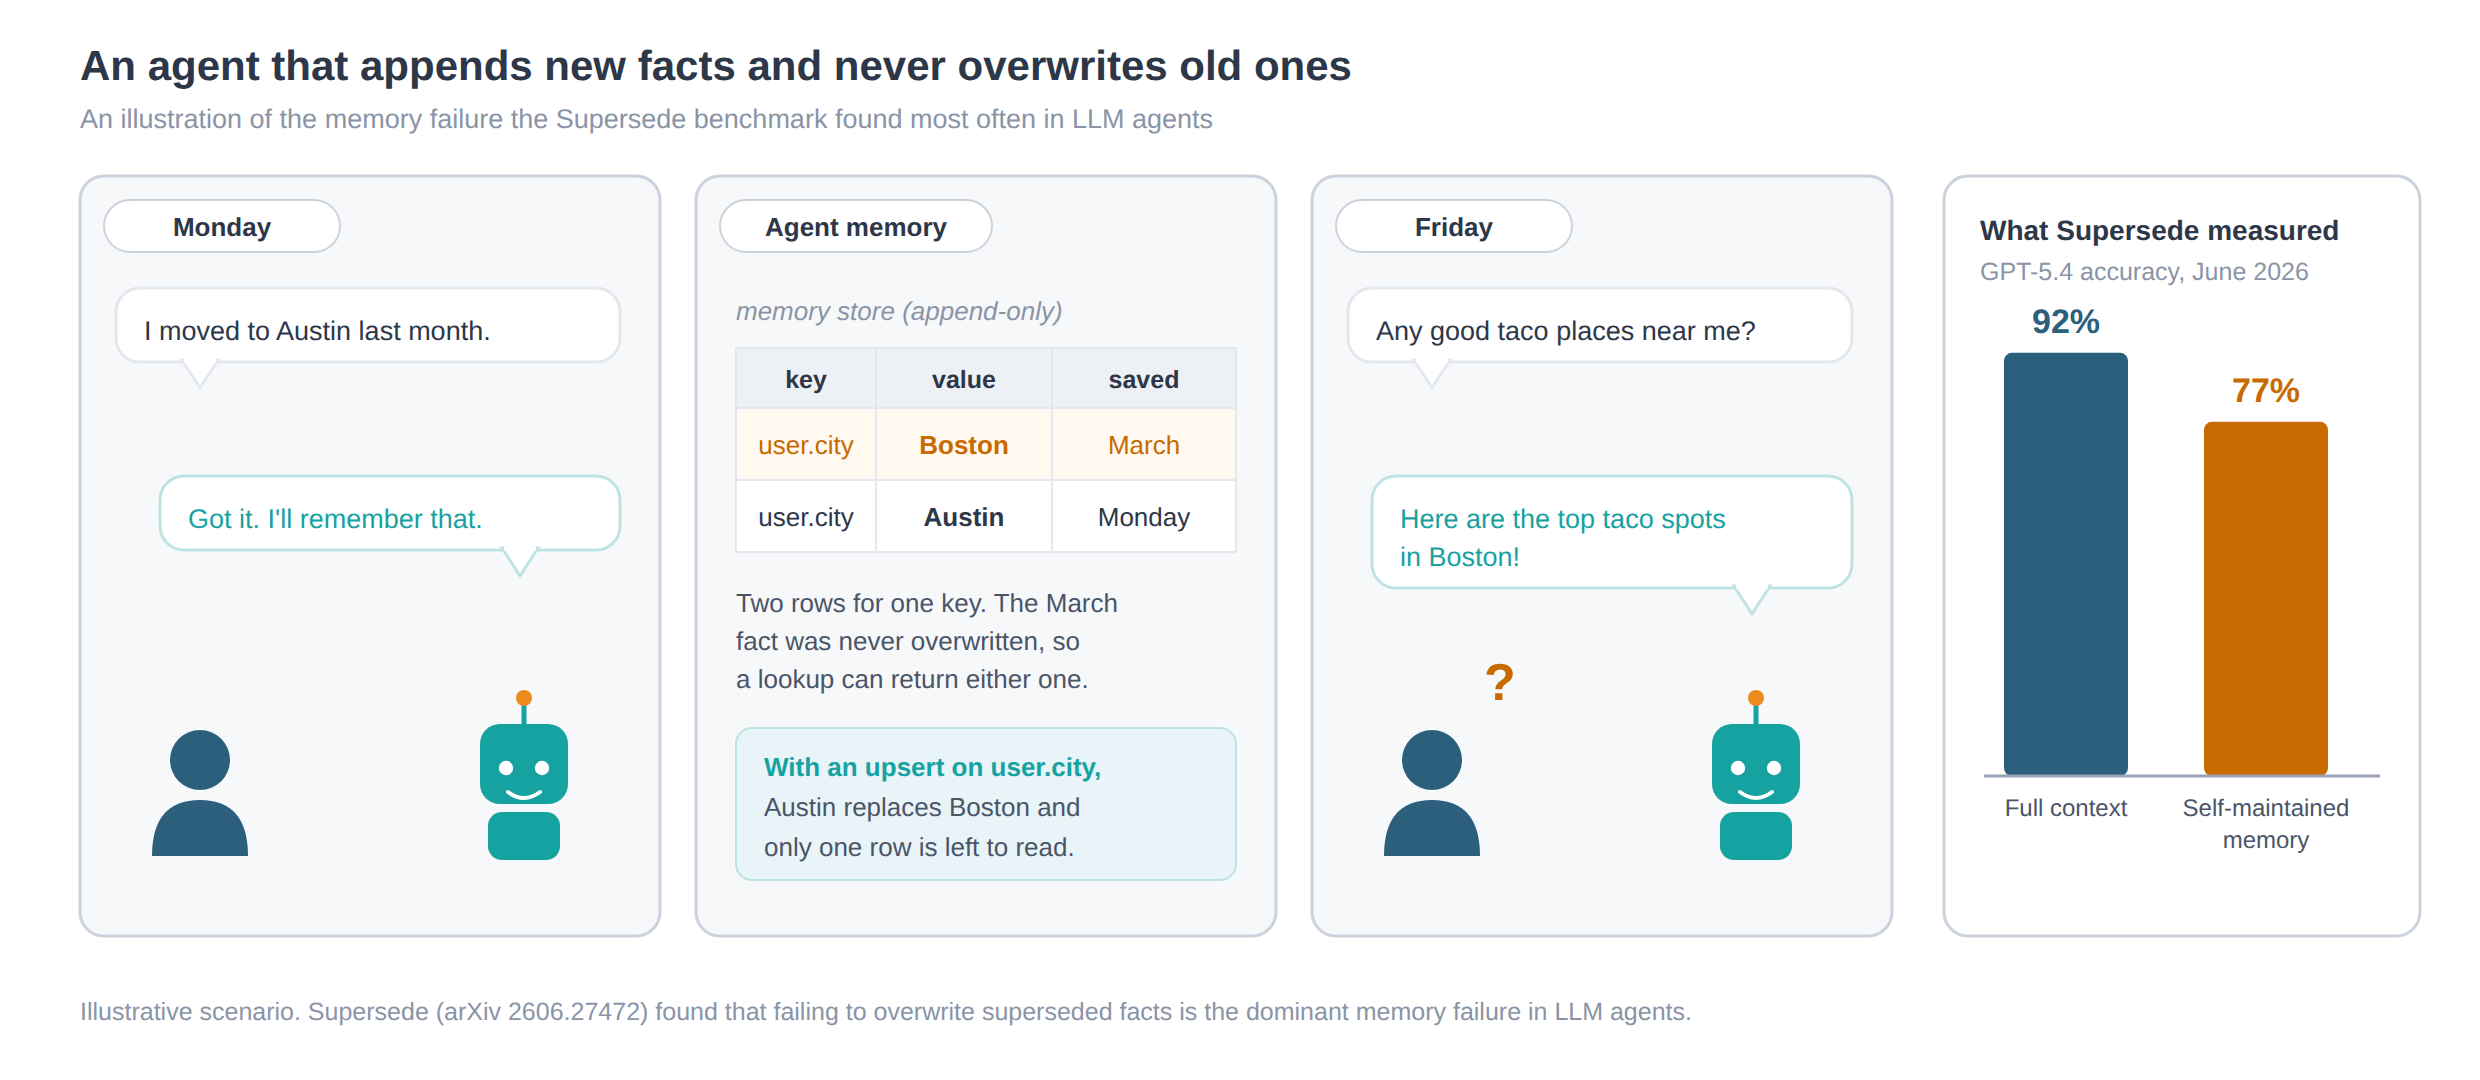
Figure 3. An illustration of an agent that appends facts without overwriting them, with GPT-5.4 results from the Supersede benchmark (arXiv 2606.27472).
DXC Technology runs this kind of pipeline on Apache Doris. Its Social Sentry system scores public social posts for student safety risk with three enrichment services (a regex pass, a local LLM, and Azure AI), and each one returns a different schema and finishes on its own schedule. DXC stores the posts in Unique Key tables with a sequence column and partial column updates, so "the stored record always reflects the latest enriched version of each post, even when scoring services finish out of order." Each service writes only the columns it owns and leaves the rest of the row alone. (VeloDB blog, Apr 2026)
Live operations boards
A live operations board shows one row per queue, agent, bed, gate, or loading dock. The board is the product itself, and because someone is watching it, a slow query shows up as a stale number on screen.
A contact center is the clearest example I've seen. Once a second, the application batches its changes into requests of about 100 rows each, mostly updates to records that already exist, and writes them to the same tables the supervisor dashboard is querying at that moment. The largest of those tables holds about 2.8 million rows at peak and has more than 50 columns, several of them JSON. The contact centerneeded queries to return in under 200 ms for many users at once while those tables took a constant stream of updates, so testing reads and writes separately wouldn't have told the team much.
Their previous stack split the work between two systems for this reason. ClickHouse held the 300 million rows of history because it reads fast, and Elasticsearch held the live data because it handles updates. ClickHouse "could not take the constant updates the live data needs," so the dashboard read from Elasticsearch at 146 queries per second.
During the evaluation, a single 3-node Apache Doris cluster handled both workloads at 1,125 queries per second with 101 ms p95 while updates ran continuously against the same tables, and those updates reduced query throughput by 8.5%. The queue table is a unique-key table on id with Merge-on-Write, so a row that has been rewritten 40 times costs a dashboard query no more to read than a row written once.
Amazon Connect, by comparison, refreshes its real-time metrics page about every 15 seconds and collects only the first 100 active queues. (AWS re:Post)
Latest-value lookups for risk and fraud
Risk and fraud systems keep one row per user, card, or account, and each event updates one of its columns, such as a rolling count, a last-seen time, or a score. The system reading that row is making a decision within a few milliseconds, and it has to act on the latest value.
Databricks described the write pattern for its feature store in August 2026 as "a large number of small upserts as fresh rolling window values are emitted on each kafka row received," with a target of 200 ms end-to-end p99 from Kafka to serving and reads at "10s of thousands of reads per second with 10s of ms of latency." Chalk puts the fraud case this way: "even 100 milliseconds of staleness can mean the difference between catching a fake account and letting it through." (Databricks; Chalk)
Merge-on-read has two problems here. Deferring the merge doesn't help even when the merge is fast, because the very next read needs to see the update. And because every read pays the merge cost, that cost multiplies at 5,000 risk checks per second.
A top-5 global crypto exchange with 80 million users and about $10 billion in daily trading volume runs this workload on VeloDB. It uses Flink CDC to sync MySQL and PostgreSQL into UNIQUE KEY Merge-on-Write tables with 1 to 3 seconds of latency. A withdrawal risk check has to answer within 200 ms, and risk and AML queries peak at 5,000 QPS with P95 inside 500 ms. The same tables serve trading competition point queries at 1,000+ QPS with P95 of 30 ms, and user lookups at P95 of 100 ms. (VeloDB blog, Jan 2026)
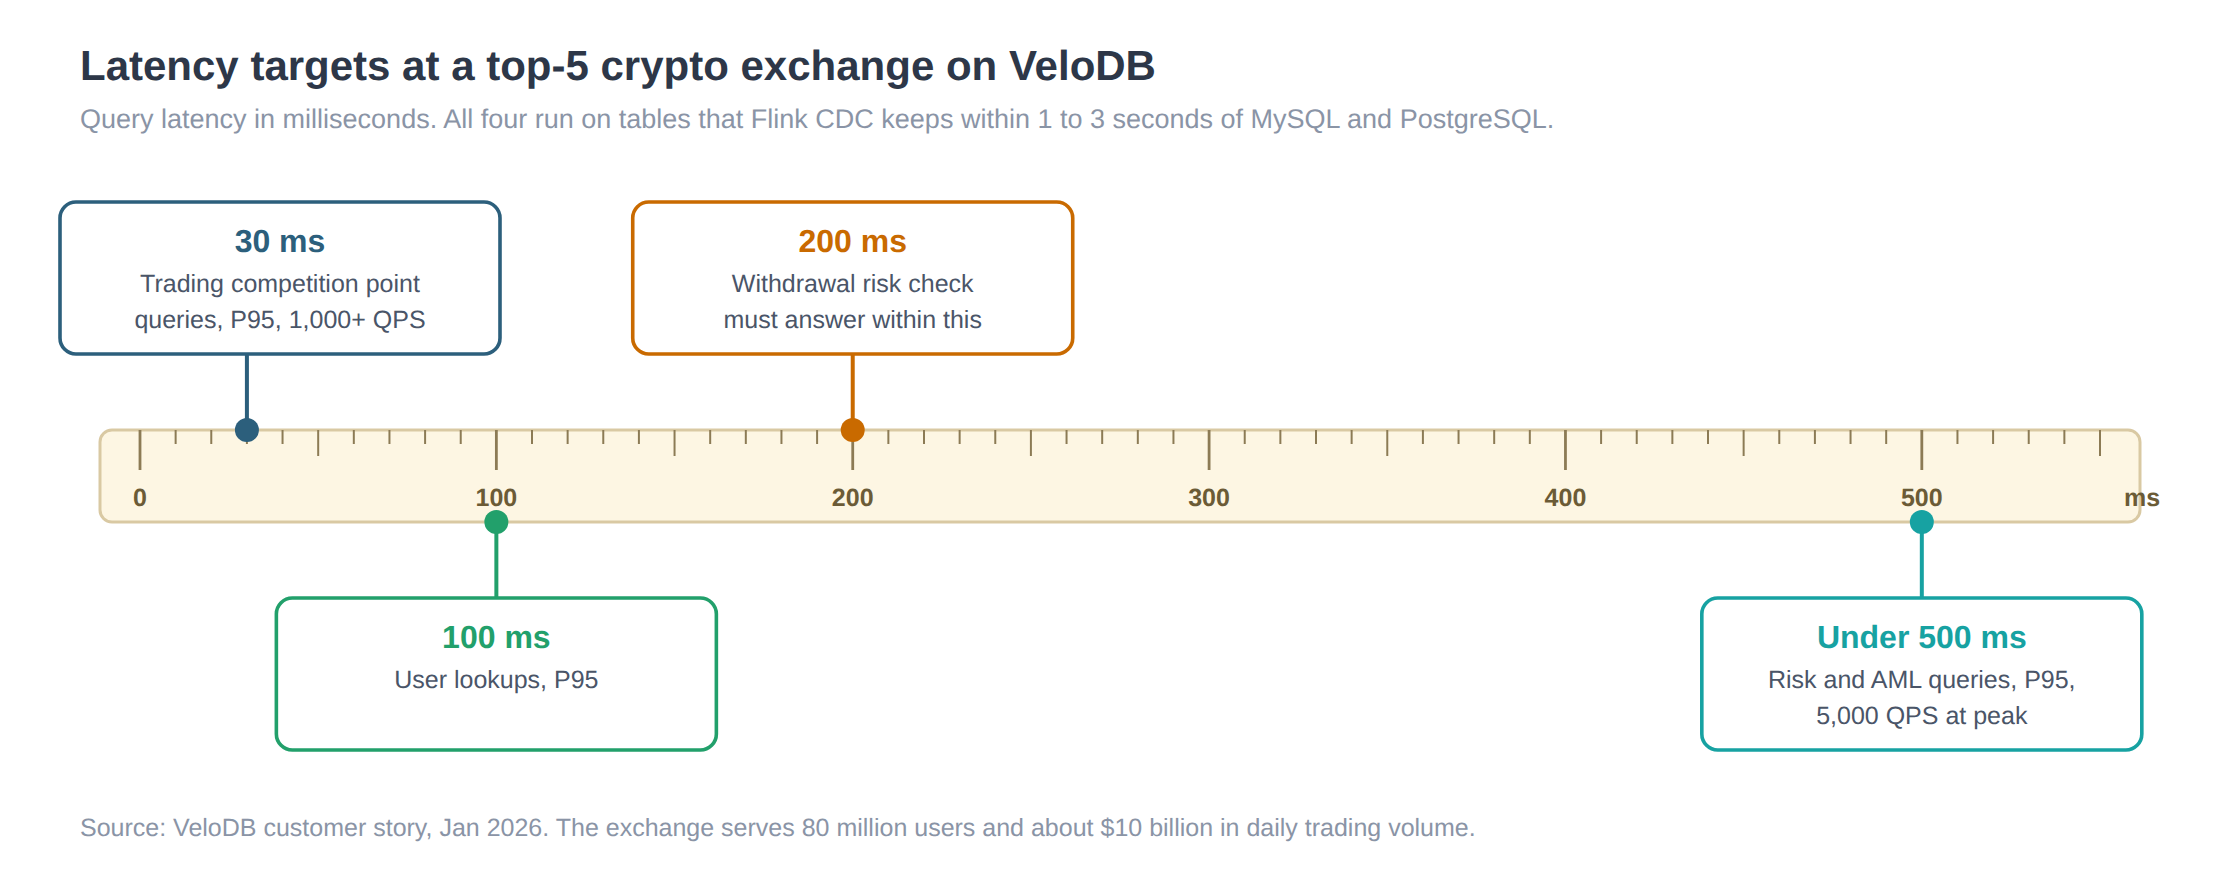
Figure 4. Query latency targets at a top-5 crypto exchange running on VeloDB, from the January 2026 customer story.
What these workloads have in common
Agent traces need partial updates that can arrive in any order and cost little to apply, and live boards need queries that stay fast while those updates land on the same tables. Risk checks need both, at thousands of queries per second, with each change visible within seconds.
Merge-on-read falls short on all three, for different reasons: traces because of how the writes arrive, live boards because of read latency, and risk checks because they need fresh data under heavy concurrency.
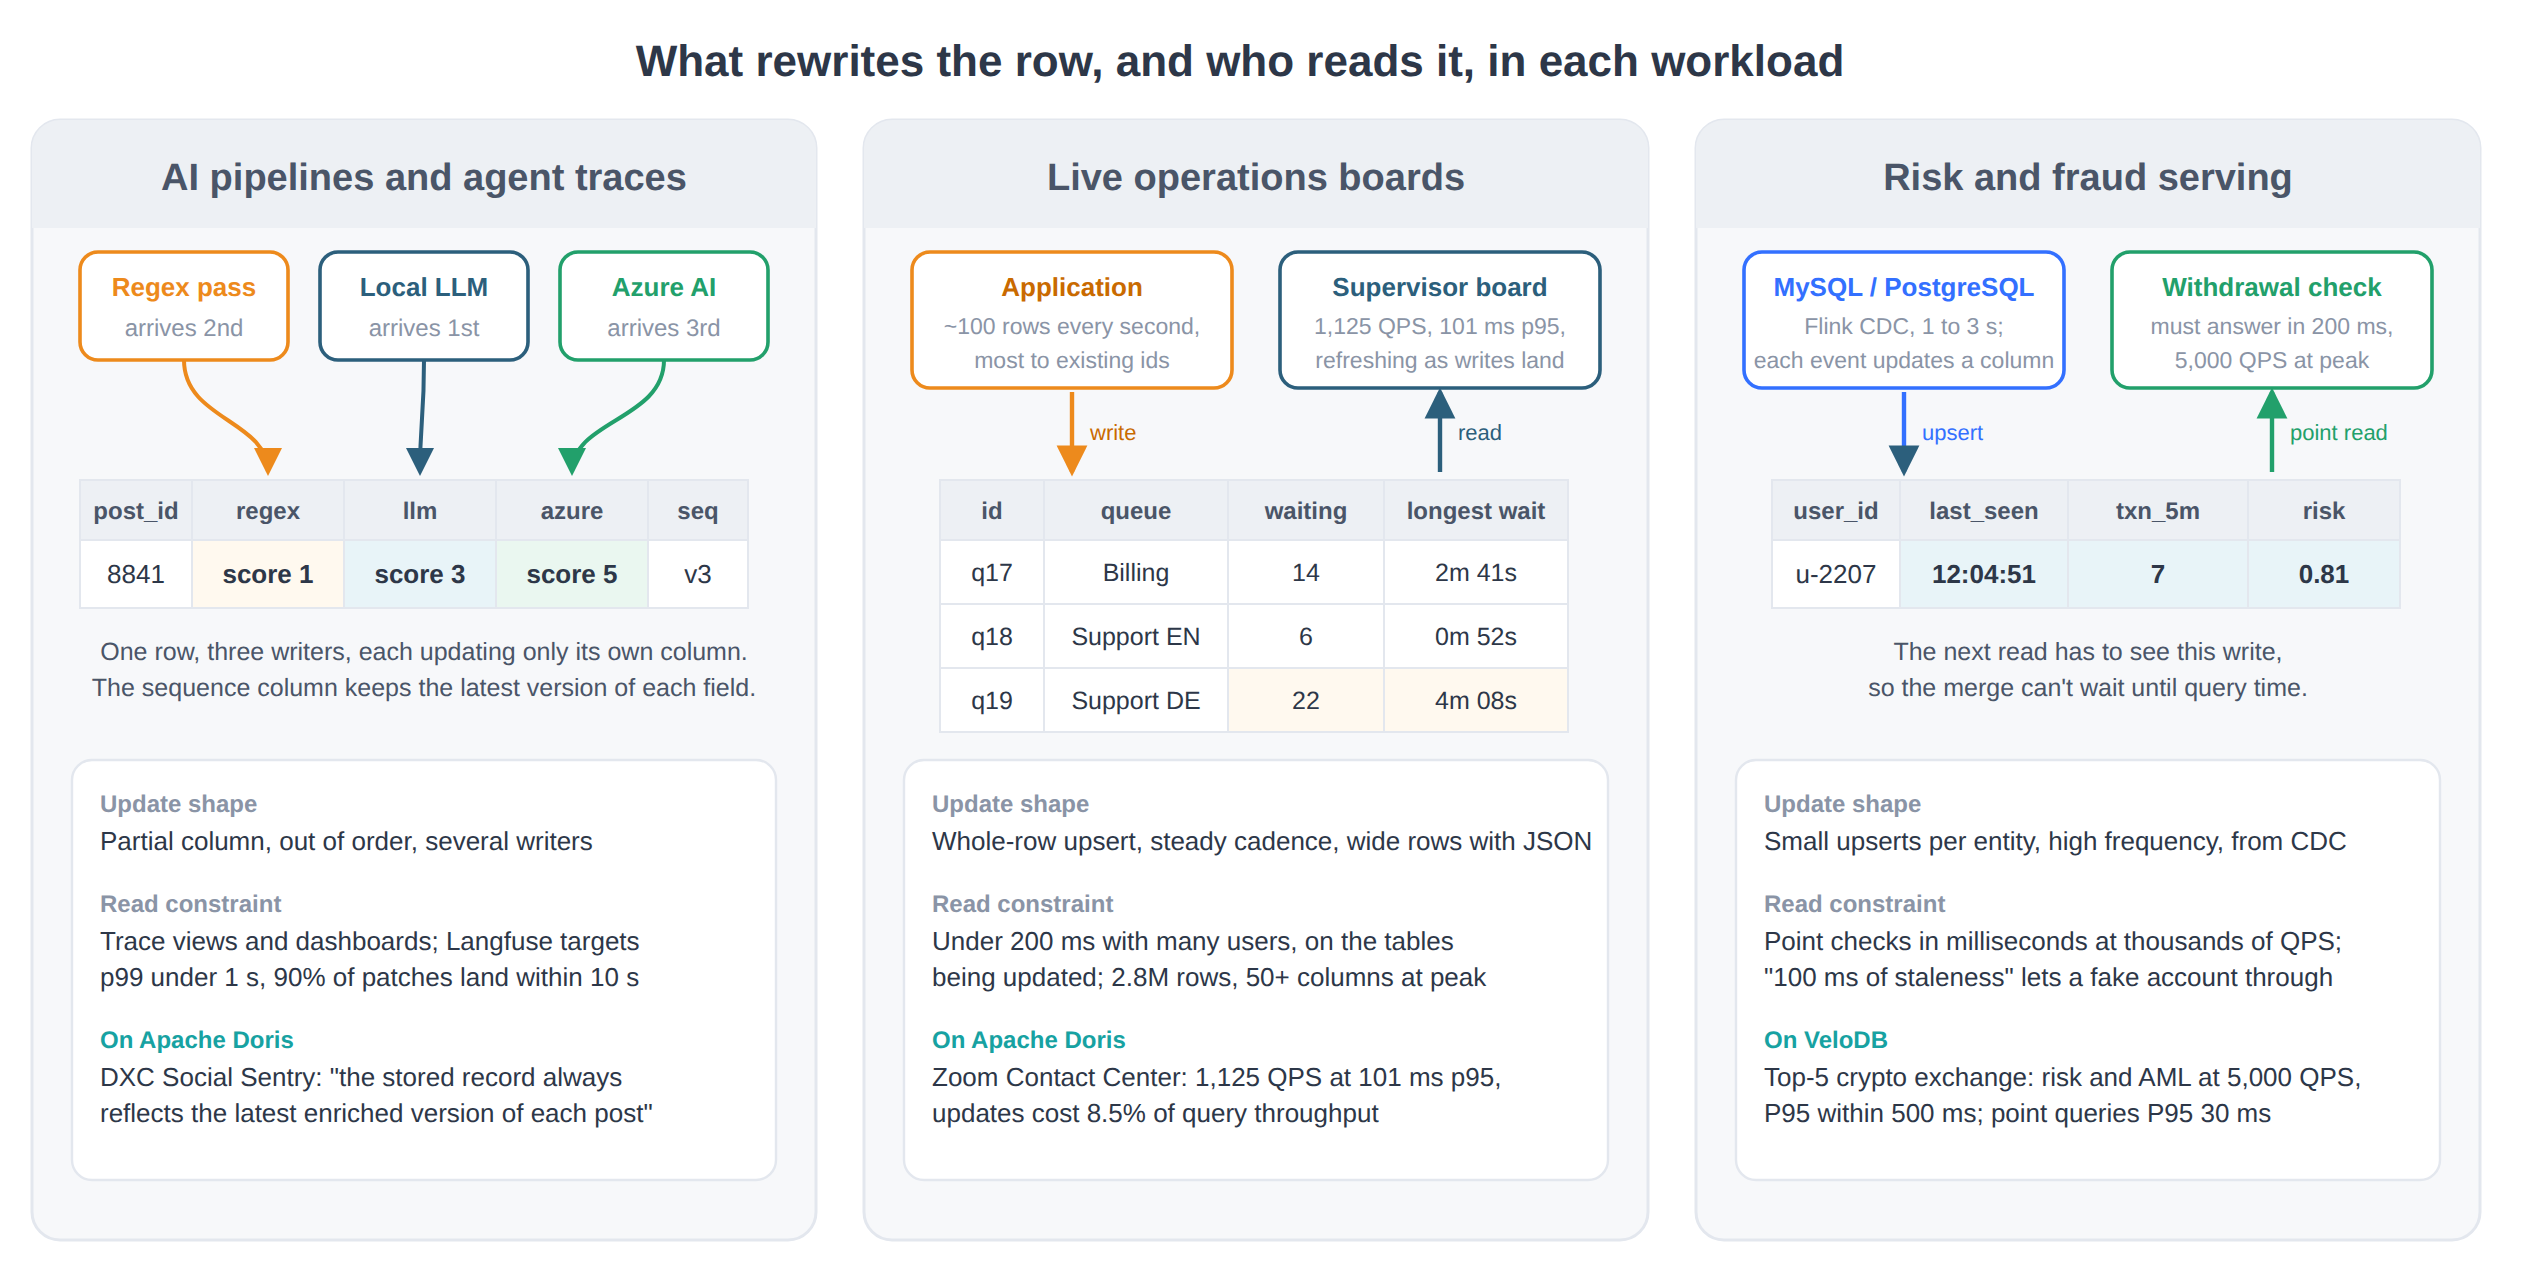
Figure 5. What rewrites the row, who reads it, and the measured result on Apache Doris or VeloDB for each workload.
| Workload | Update pattern | Read requirement | Result on Apache Doris / VeloDB |
|---|---|---|---|
| AI pipelines and agent traces | Partial column, out of order, several writers per row | Trace views and dashboards; Langfuse targets p99 under 1 s | Sequence column plus partial updates keep "the latest enriched version of each post" (DXC Social Sentry) |
| Live operations boards | Whole-row upsert, about 100 rows/s, mostly existing keys | Under 200 ms, many concurrent users, on the tables being updated | 1,125 QPS at 101 ms p95, updates cost 8.5% throughput |
| Risk and fraud serving | Small upserts per entity from CDC at 1 to 3 s latency | Point checks within 200 ms at thousands of QPS | 5,000 QPS at P95 under 500 ms for risk/AML; 1,000+ QPS at P95 30 ms (crypto exchange) |
What performance do you need, and how do you measure it?
If you're evaluating a database for any of these workloads, ask the vendor for three numbers.
Update visibility latency. The time from a change at the source until a query returns the new value. The crypto exchange sees 1 to 3 seconds through CDC, and Databricks targets 200 ms p99 for features.
Read latency under update load. The p95 or p99 query latency while updates land on the same table. In the contact center's example, we measured 101 ms p95 at 1,125 QPS, and the exchange held P95 under 500 ms at 5,000 QPS.
Degradation as the updated share of the table grows. How much slower queries get after a quarter of the rows have been rewritten, and again after all of them have.
Standard benchmarks won't give you these numbers, so plan to measure them yourself. ClickBench, SSB, and TPC-H load a table once and never modify it, which means they never show what happens as updates pile up. To run the test, load your dataset, re-insert about a quarter of the rows as updates, and time your queries. Then re-insert all of the rows and time the queries again. Keep ingestion running while you query, test at the concurrency you expect in production, and include agent query volume if agents are on your roadmap. Before you compare speed, check that the results are correct. On ClickHouse, that means using FINAL or an equivalent, because a query that returns duplicate or outdated rows isn't a fair comparison, no matter how fast it runs.
We ran this test and published the results. On the Star Schema Benchmark, VeloDB's total query time rose 13% as the updated share grew from a quarter of the rows to all of them, while ClickHouse Cloud on ReplacingMergeTree rose about 50%. With every row updated, VeloDB finished 18x faster than a 2 x 16 vCPU ClickHouse cluster and up to 34x faster than a smaller 2 x 8 vCPU one. The setup, queries, and results are in the benchmark post and its open GitHub repo.
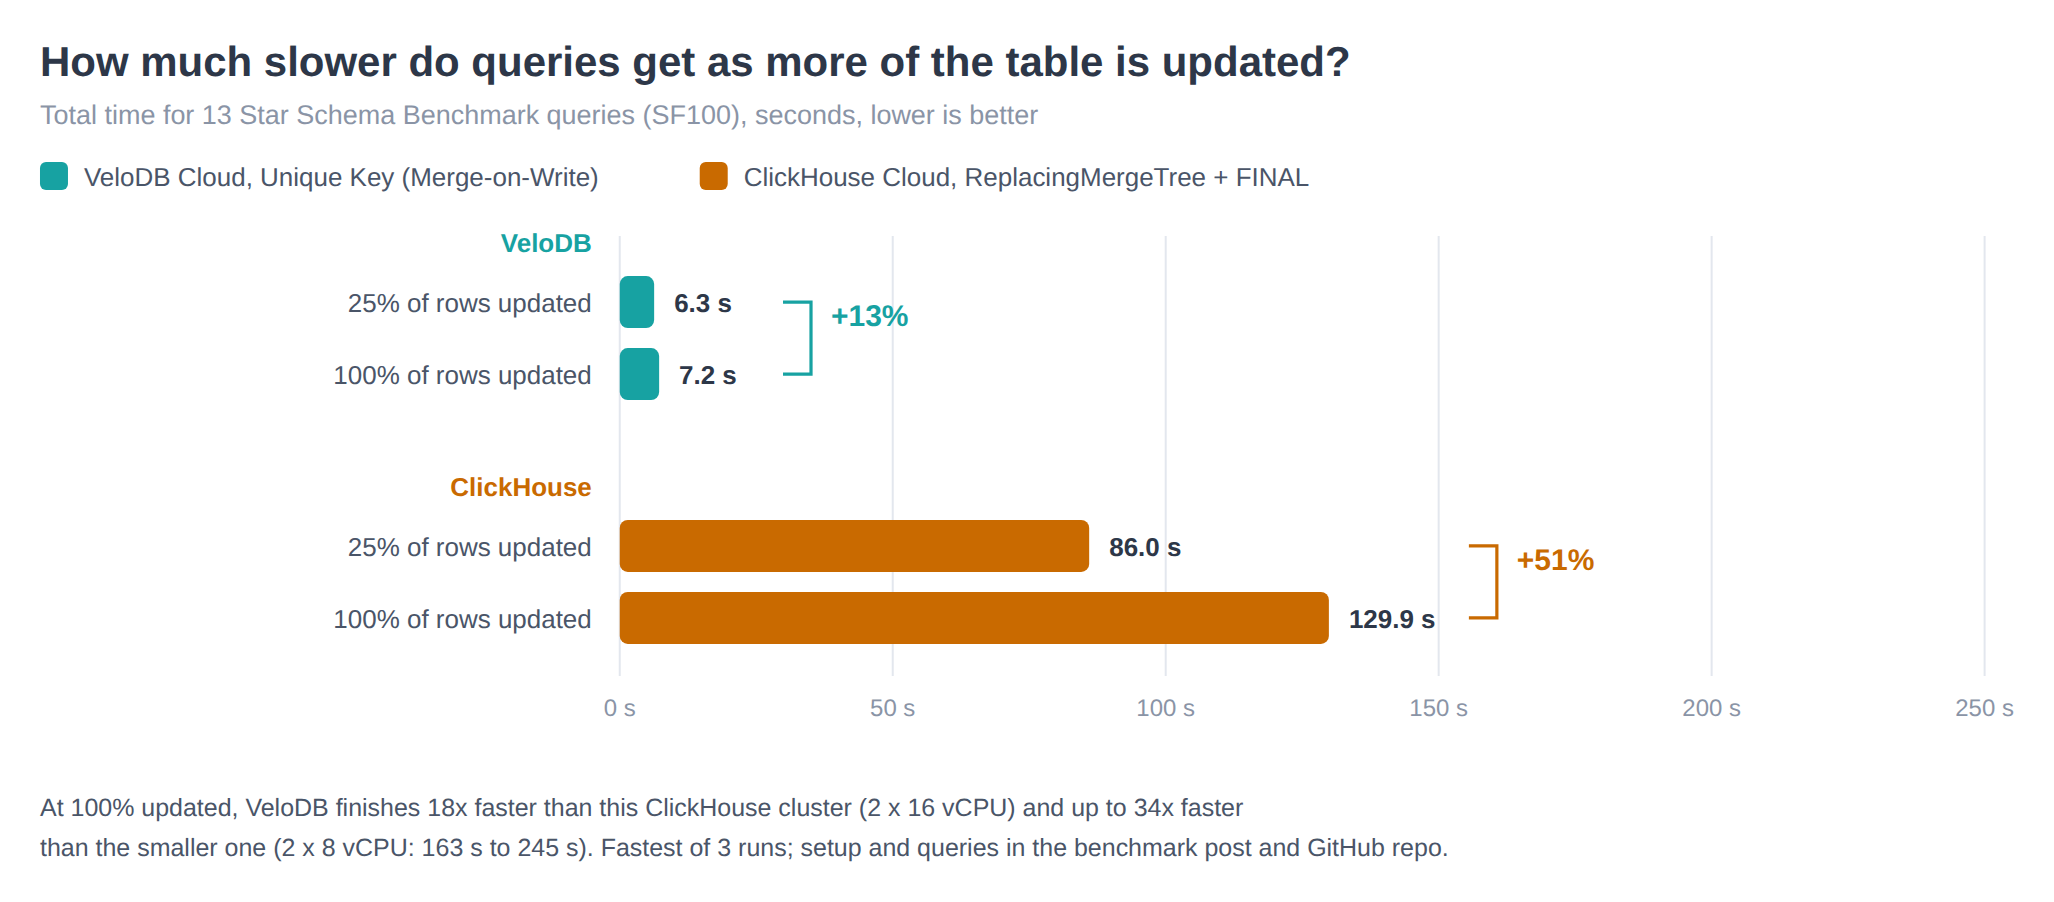
Figure 6. Total Star Schema Benchmark query time after 25% and 100% of rows were updated, from the VeloDB update benchmark. Setup and queries are in the linked post.
How does Apache Doris handle updates without slowing reads?
Apache Doris resolves old versions of a row at write time. When a row is written to a Unique Key table, Doris looks up its key in a per-segment primary key index, flips the old row's bit in a delete bitmap, and appends the new row. Queries skip any row whose bit is set, so they read one version per key without merging anything, and compaction removes the dead rows later. The Doris docs put it this way: "Read performance does not degrade as past updates accumulate." Doris calls this design Merge-on-Write. It shipped in Doris 1.2 and has been the default since 2.1. The current stable release is 4.1.4. (Doris docs)
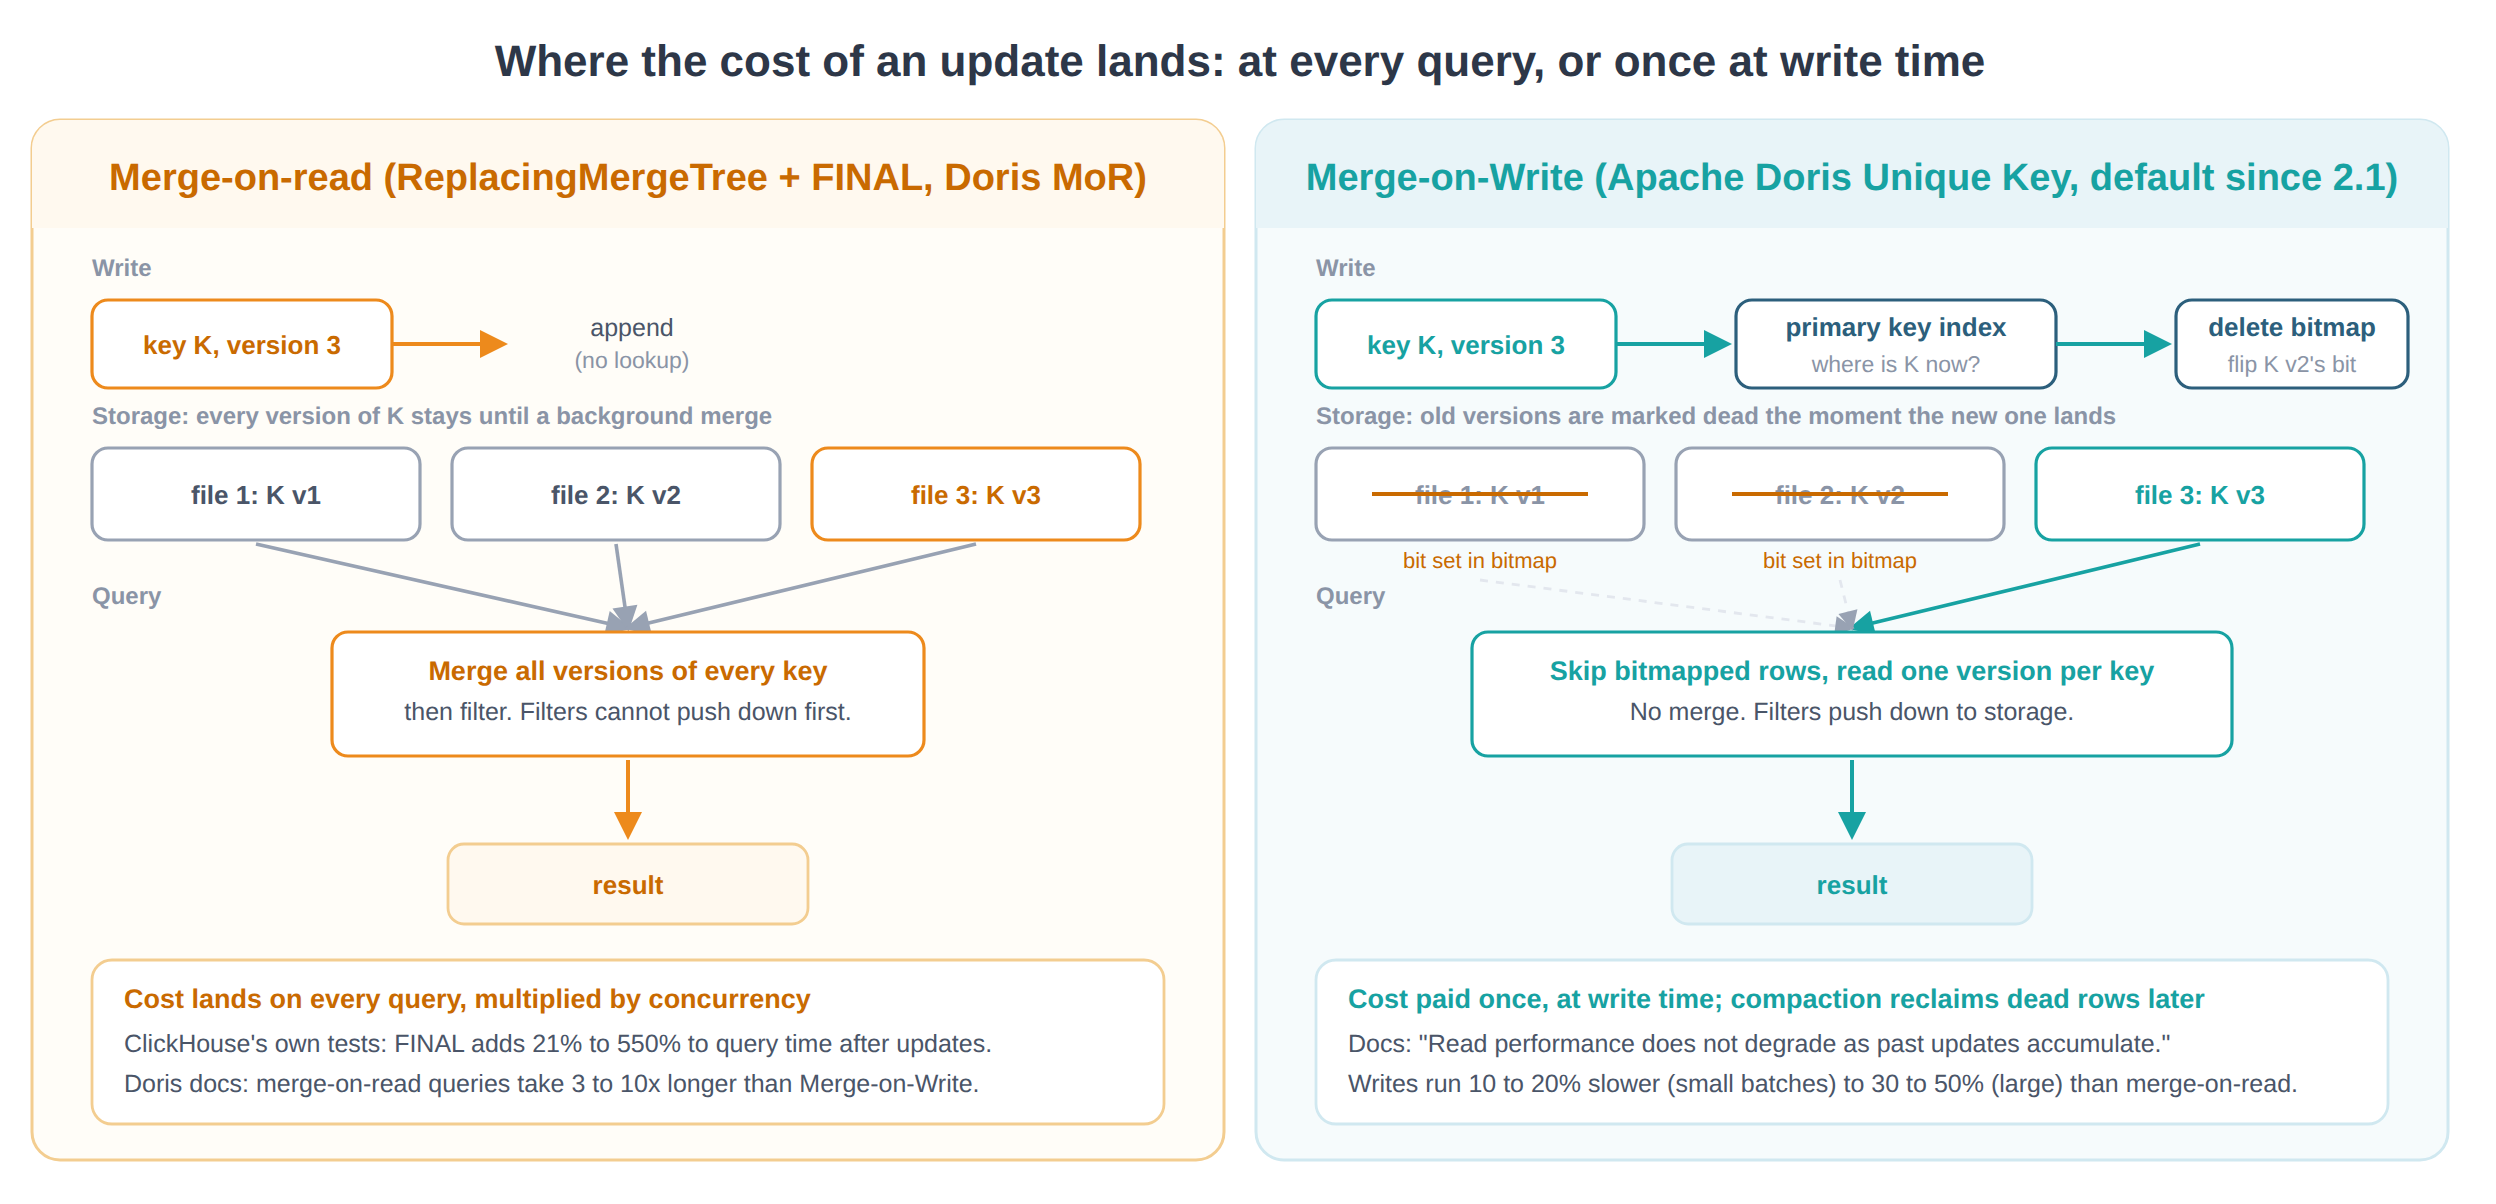
Figure 7. Merge-on-read reconciles every version at query time. Merge-on-Write marks the old row in a delete bitmap when the new one lands, so queries read one version per key.
Several Doris features build on Merge-on-Write, and they line up with the workloads above.
Partial column updates let each writer update only the columns it owns, which is what enrichment pipelines and traces need. Since Doris 3.1, flexible partial updates also let each row in a single load update a different set of columns.
Sequence columns decide which version wins when writes arrive out of order: "The larger value wins. Equal values fall back to load order." That covers out-of-order patches in traces and late events in CDC.
The delete sign turns CDC deletes into a flag on a hidden column, and the Flink Doris Connector sets that flag automatically for MySQL, PostgreSQL, Oracle, SQL Server, MongoDB, and DB2 sources.
Row store (store_row_column) serves the point lookups behind a risk check without reassembling the row from columns.
ANN indexes on Merge-on-Write tables, added in 4.1.4, let you run vector search over traces in the same table that receives the updates.
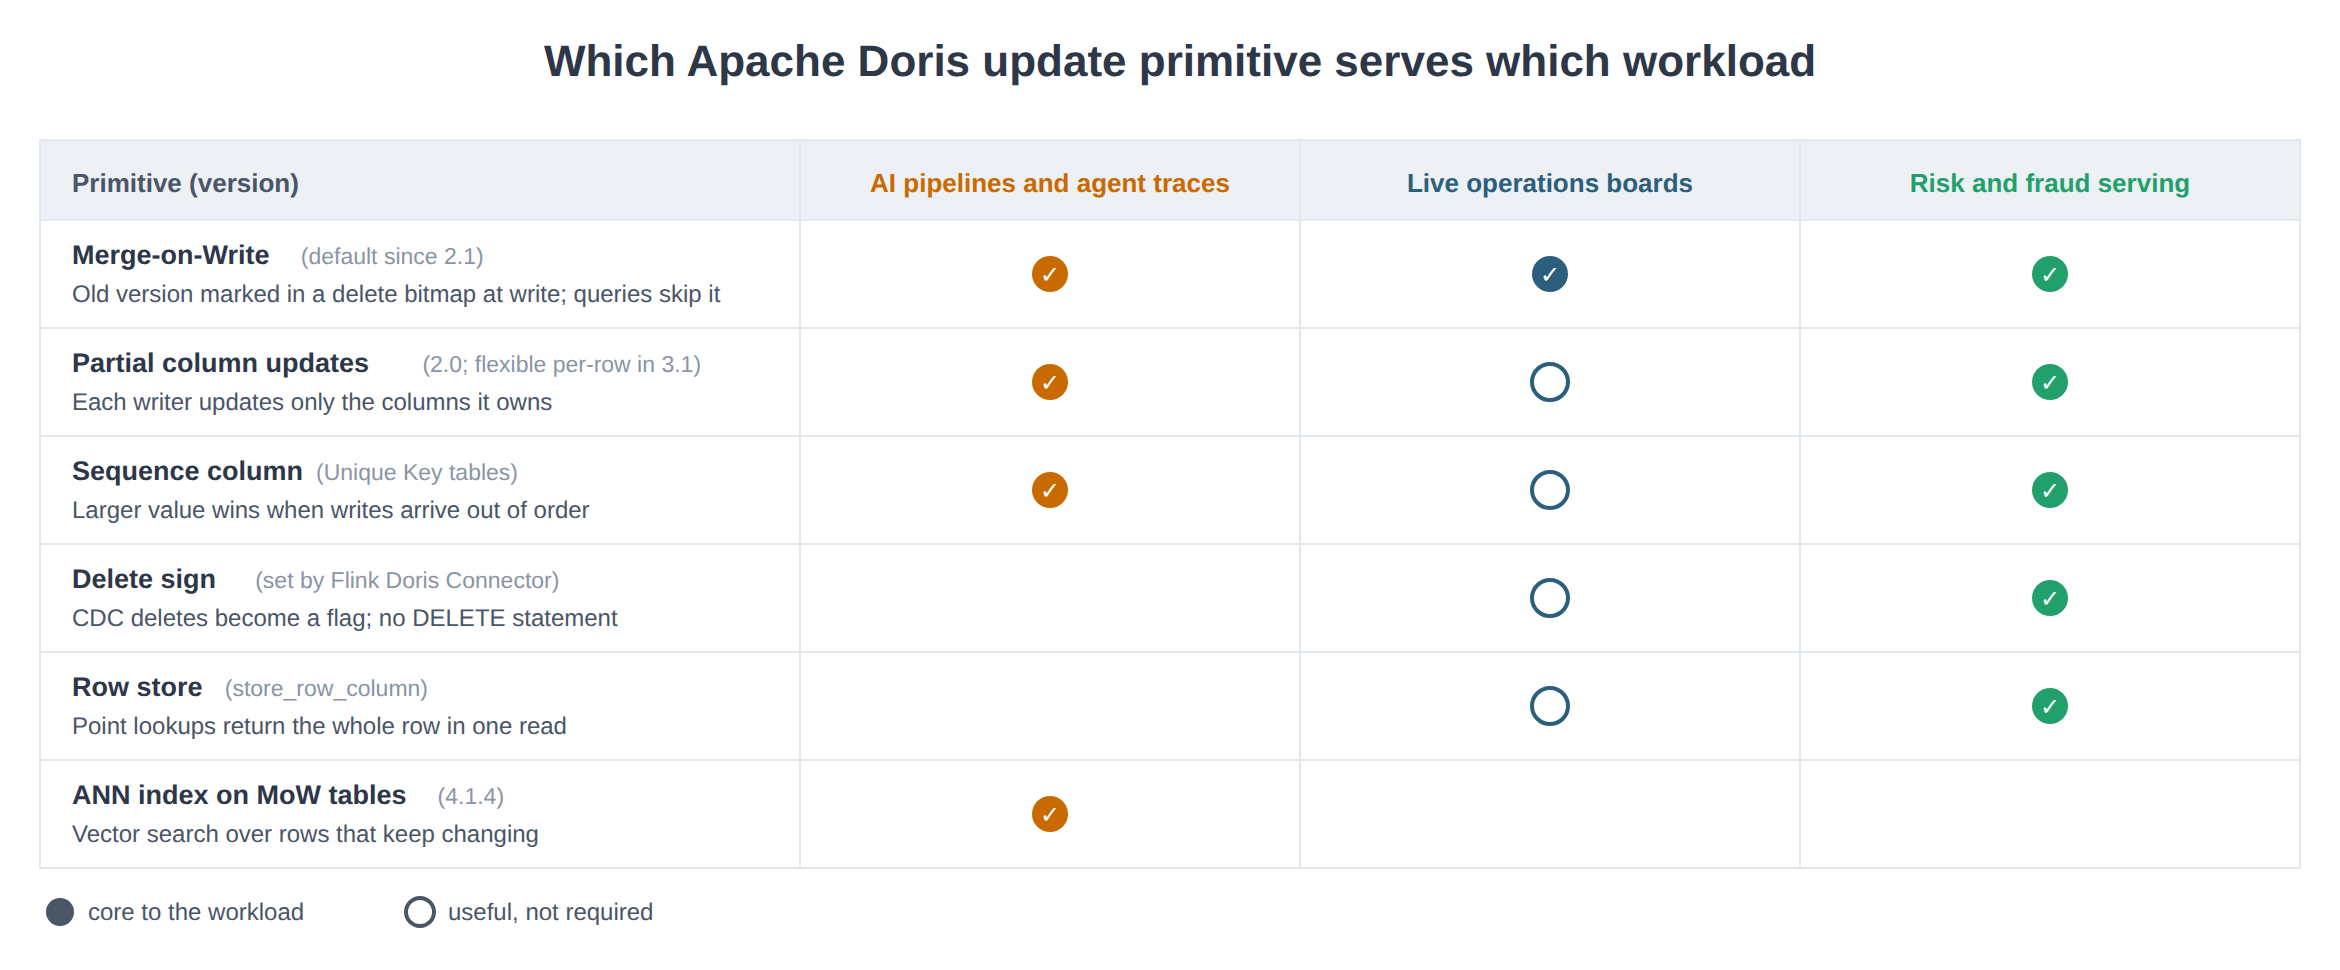
Figure 8. Which Apache Doris update primitive each workload depends on.
Merge-on-Write also holds up in large production deployments. ZTO Express keeps a 4.5-billion-row, 200-column shipment table that takes 600 million record changes a day, 80% of them updates to existing rows, and its multi-dimensional filter queries dropped from over 1 minute to under 1 second on one third of the hardware. Cainiao writes about 50,000 rows per second per table into tables with 300 to 400 columns and serves point queries at 1,000 to 2,000 QPS in 10 to 100 ms. An insurance customer data platform measured more than 300,000 upserts per second in a 30-thread ingestion test. (ZTO; Cainiao; CDP)
When is Merge-on-Write the wrong choice?
Merge-on-Write has costs, and the Doris docs list them. Writes are about 10 to 20% slower than merge-on-read for small batches and 30 to 50% slower for large ones, and compaction uses more CPU. Partial updates on very wide tables also read and write more data than the update itself, because the engine fills in the rest of the row at write time. In the docs' example, a 1 MB update to 10 columns of a 100-column table causes about 9 MB of reads and 10 MB of writes. Row store and flexible partial updates reduce that overhead. (Doris update overview)
Some workloads are better served by other options. Append-only event streams gain nothing from the per-write key lookup and belong in the Duplicate Key model. Random or very wide primary keys, such as UUIDs, hurt the index's cache locality, so narrow integer keys work better. Tight loops of single-row UPDATE statements spend most of their time on commit overhead and should be batched into load-based upserts.
If your data is effectively immutable, or your updates touch a few percent of a table now and then, ClickHouse's lightweight updates are designed for that case. The three workloads in this post fall well outside that range.
FAQ
Is Apache Doris faster than ClickHouse for real-time updates?
On the Star Schema Benchmark with 100% of rows updated, VeloDB (Apache Doris with Merge-on-Write) ran up to 34x faster than ClickHouse Cloud using ReplacingMergeTree with FINAL, and its query time degraded 13% versus about 50% for ClickHouse as the updated share grew from a quarter of rows to all of them. ClickHouse's newer lightweight updates are in beta and designed for updates of up to about 10% of a table.
What is Merge-on-Write in Apache Doris?
Merge-on-Write is the default implementation of the Unique Key table model since Doris 2.1. When a row with an existing key is written, Doris marks the old version in a delete bitmap and appends the new one, so queries read a single version per key without merging at read time. Merge-on-read, the older option, keeps every version and reconciles during queries, which the Doris docs describe as 3 to 10 times slower.
Do updates slow down queries in Apache Doris?
Query cost stays flat as updates accumulate, because Doris reconciles versions at write time. We measured an 8.5% cost in query throughput with updates running continuously against the tables being queried, at 1,125 QPS and 101 ms p95. Updates do have a cost, and it appears on the write side: writes run roughly 10 to 50% slower than merge-on-read depending on batch size, and compaction uses more CPU.
Can Apache Doris handle CDC from PostgreSQL and MySQL?
Yes. The Flink Doris Connector integrates Flink CDC for MySQL, PostgreSQL, Oracle, SQL Server, MongoDB, and DB2, writes changes as upserts into Unique Key tables, and maps deletes to the delete sign column. A top-5 crypto exchange syncs MySQL and PostgreSQL into VeloDB this way with 1 to 3 seconds of end-to-end latency.
How do partial column updates work in Apache Doris?
Since Doris 2.0, a load on a Merge-on-Write table can update only the columns it names and leave the rest of the row untouched. Flexible partial updates in 3.1 and later go further by letting each row in one load update a different set of columns from JSON input. When you combine partial updates with a sequence column, several services can enrich the same row out of order, and the latest version of each field wins.
Test it yourself
If you're evaluating a real-time analytics database for agents, live dashboards, or risk serving, run it with the update ratio your CDC stream actually produces and measure query latency while the updates land.
The ZTO Express use case shows the architecture at 600 million changes a day, and the update benchmark has the queries and load scripts you need to reproduce the test.
Test your updates workloads on VeloDB Cloud, and join the Apache Doris Slack to connect with engineers who built Merge-on-Write.