- Products
- Solutions
Real-Time Analytics
Sub-second dashboards and data products on petabytes of data at any concurrency
Data Warehousing
Sub-second analytics on open lakehouse formats with no vendor lock-in
Observability in the AI Era
The most cost-effective alternative to Elasticsearch observability
Context Engineering
Hybrid search and fresh context for RAG, agents, and LLMs
- Docs
- Resources
- Pricing
- Contact us


Online demo applications
for typical use cases
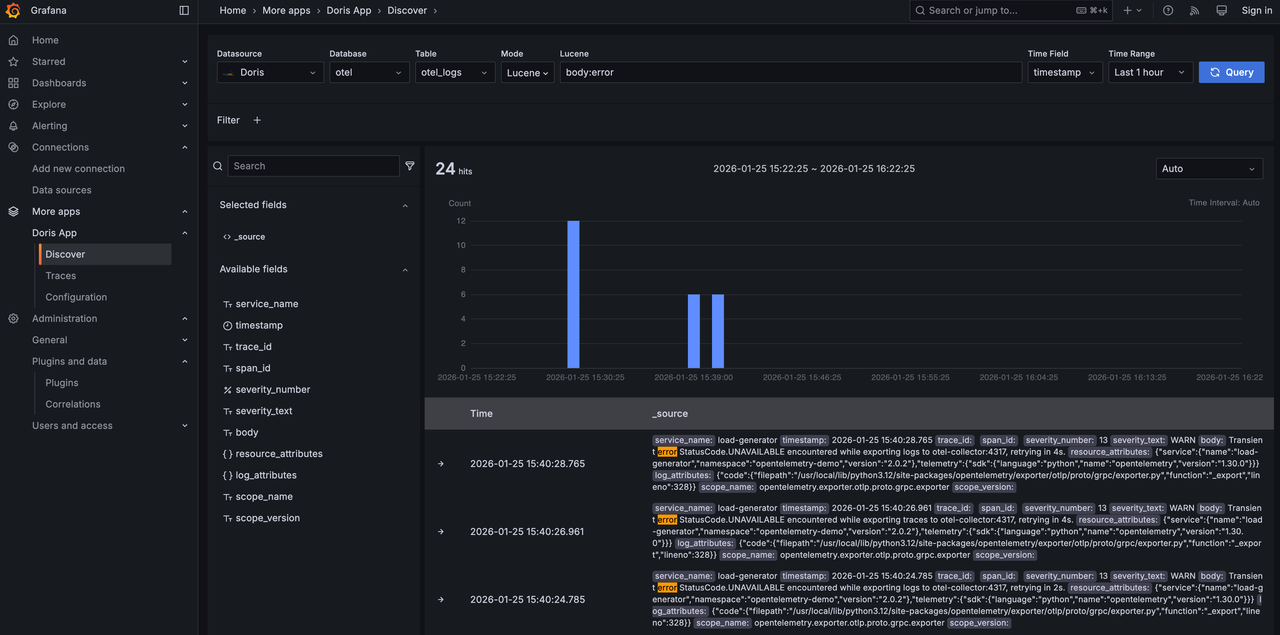
Try the open observability demo based on OpenTelemetry, VeloDB, and Grafana with doris app.
You can experience the interactive search and analysis capabilities similar to Kibana. Both Lucene and SQL syntax are supported. You can filter, sort, and visualize traces like Jaeger. You can also build and view dashboard using more than 20 kinds of visualizations such as line chart, bar chart, pie chart, gauge, heatmap, histogram.
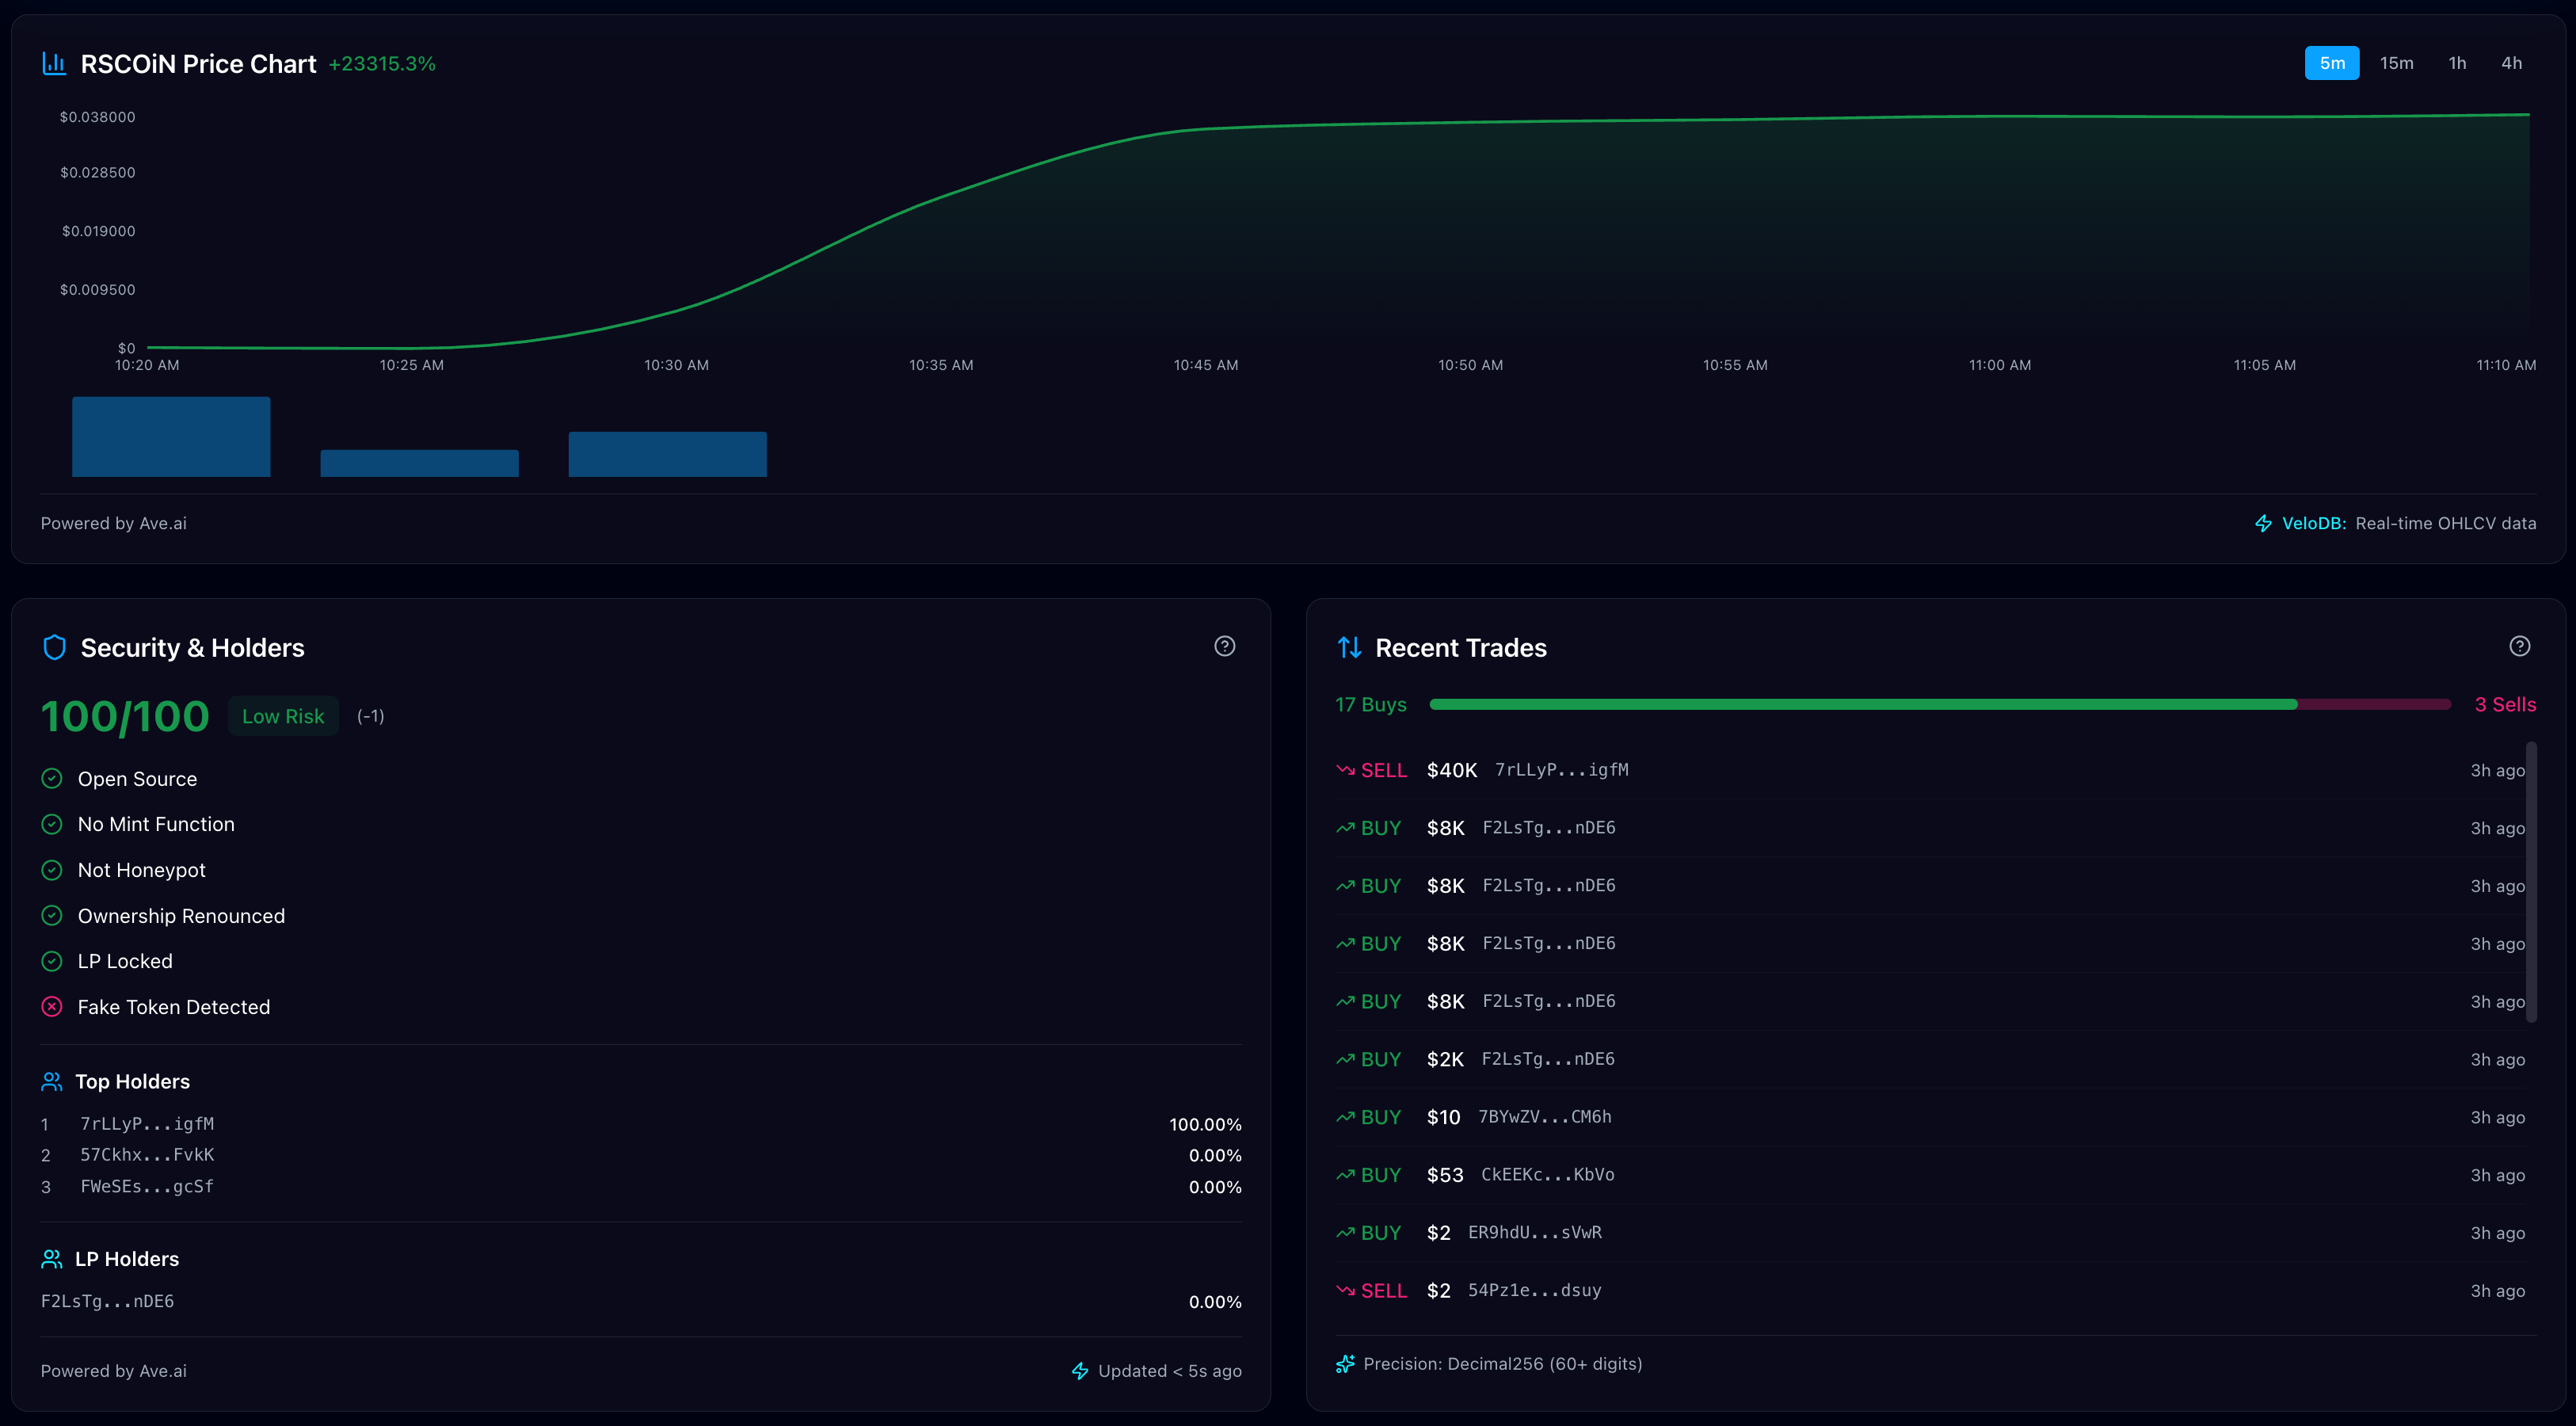
Experience the power of VeloDB in processing massive, high-frequency blockchain data.
You can get the next-generation real-time data warehouse handles the complexities of Web3 data with sub-second latency. You can explore the limits of high-frequency blockchain data processing and see how our architecture eliminates the bottleneck between the chain and your insights.