





TL;DR. Apache Doris now has a Profile diagnostic page on doris.apache.org and an open source skill, doris-profile-reader, that reads query profiles the way a senior DBA does. It grades counters as root cause or process signals, checks plan shape before blaming an operator, blocks conclusions until prerequisite checks are done, and labels every finding proven, likely or not proven. It follows the release of VeloDB Agent Skills for VeloDB Cloud.
Install the skill:
npx skills add apache/doris-skills
What is the Apache Doris Profile diagnostic page?
The Profile diagnostic page is a tool on the Apache Doris website where you upload a query profile and get a visual view of the logical plan and the physical execution fragments, with the slowest operators ranked by max execution time. It can also generate an AI diagnosis report that walks from conclusion to evidence to recommended actions. The rules behind that report are open source in the apache/doris-skills repository, and this post explains how they work, using doris-profile-reader as the example.
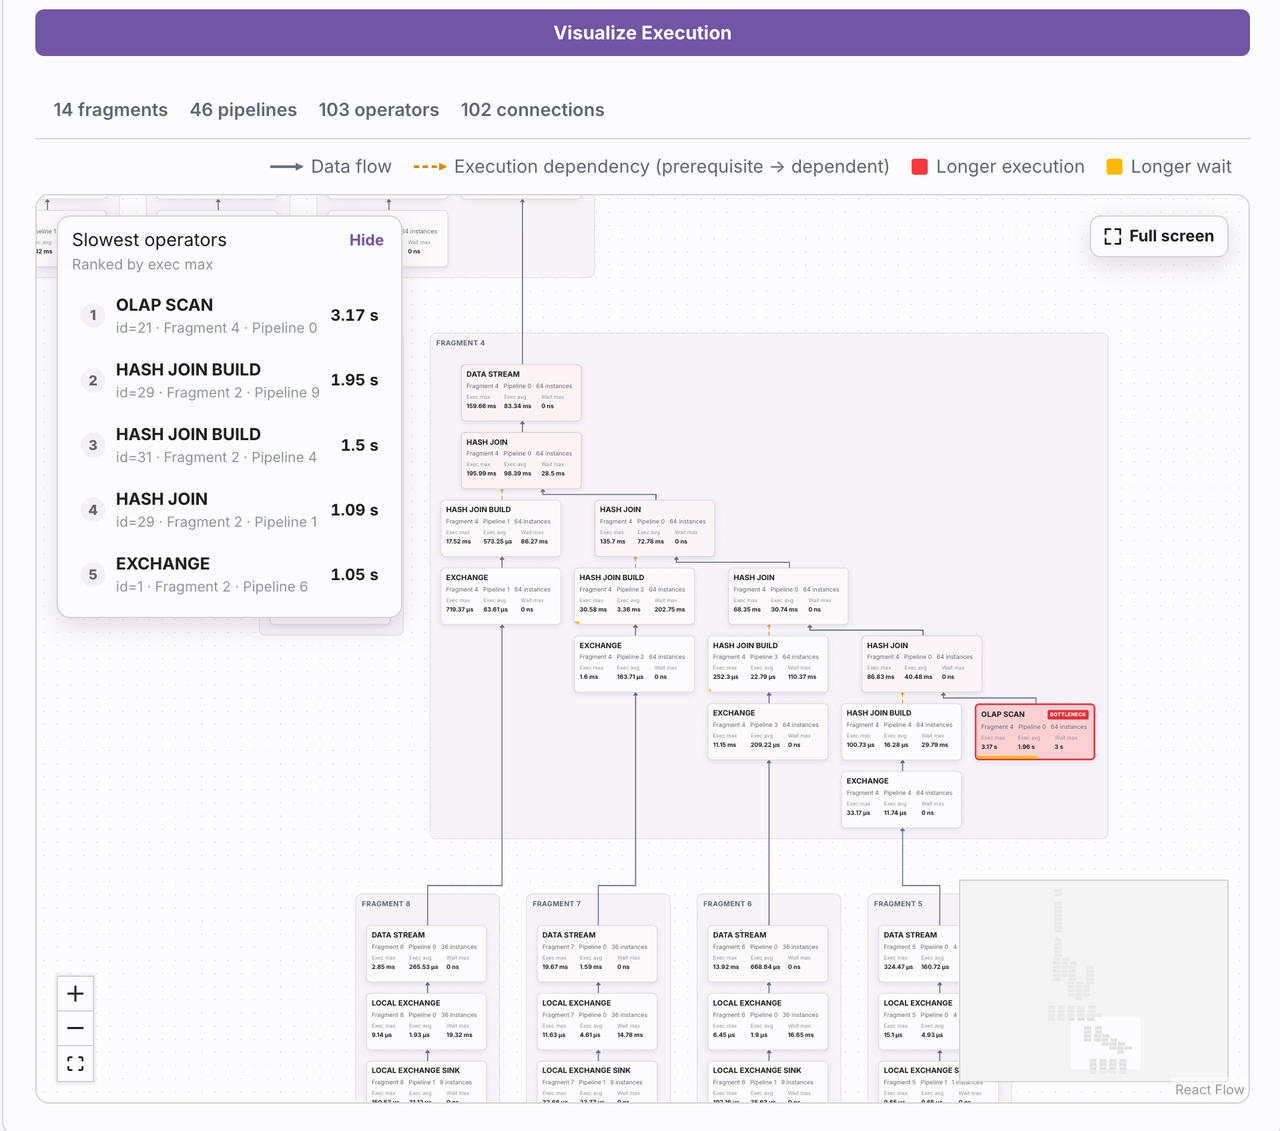
The Profile diagnostic page renders fragments, pipelines and operators, and ranks the slowest operators by max execution time.
The page and the skill grew out of VeloDB Agent Skills, which we released for VeloDB Cloud users earlier this year. Those skills teach Claude Code, Cursor, Windsurf and other coding agents how to size clusters, design tables and troubleshoot slow queries, with profile analysis through VeloCLI. They were built from patterns across 11 industry whitepapers and the support cases behind 500 enterprise customers and 5,000 open source adopters. The response from VeloDB Cloud users was strong, and the same approach is now available to every Apache Doris user.
Why does generic AI mishandle a Doris query profile?
General-purpose models know little about how the Doris kernel executes a query, so they misread profiles in predictable ways. Two examples from a single 13-second query show the pattern.
Misdiagnosis 1: cause and effect reversed
The profile showed EXCHANGE_OPERATOR spending 11.9 seconds in WaitForData0:
Fragment 2 · EXCHANGE_OPERATOR (id=5)
   - ExecTime:                  avg 12s41ms, max 12s388ms
   - WaitForData0:              11s903ms
   - RowsProduced:              1.02M
   - GetDataFromRecvrTime:      41.2ms
A generic model concludes that the Exchange operator waited 12 seconds for data, which is most of the query time, so it is the bottleneck: raise parallelism and check the network between BE nodes.
WaitForData0 measures how long the Exchange receiver waited for the upstream operator to send data. The time was spent upstream, in HASH_JOIN_SINK_OPERATOR, whose build phase took 11.8 seconds.
Misdiagnosis 2: sum confused with max
HASH_JOIN_SINK_OPERATOR showed an ExecTime sum of 47.9 seconds, well above the 13 second total for the whole query:
Fragment 1 · HASH_JOIN_SINK_OPERATOR (id=4)
   - ExecTime:                  sum 47s912ms, avg 11s978ms, max 12s31ms
   - BuildTime:                 11s844ms
   - BuildRows:                 218,412,096
   - MemoryUsageHashTable:      9.62 GB
   - RuntimeFilterInfo:         RF000[in_or_bloom] <- fact_events.user_id
Without kernel knowledge, an AI sorts operators by sum and picks the one with the highest parallelism as the slowest node, even when that operator ran smoothly. In Doris’s multi-instance execution model, the max value across instances measures real blocking time. The sum across concurrent instances measures total CPU work, and it will always exceed wall clock time.
| Profile evidence (13 second query) | Generic AI reading | doris-profile-reader reading |
|---|---|---|
| EXCHANGE_OPERATOR WaitForData0 = 11.9 s | Exchange is the bottleneck; add parallelism, check BE network | WaitForData0 is a process signal: receiver waiting on upstream. Look upstream |
| HASH_JOIN_SINK_OPERATOR BuildTime = 11.8 s, BuildRows = 218 M | Not examined | Root cause: hash join build. Check join order and build vs probe side |
| HASH_JOIN_SINK_OPERATOR ExecTime sum = 47.9 s, max = 12.0 s | Sort by sum; this operator “took 47.9 s” | Use max for blocking time (12.0 s). Sum is total CPU work across instances |
Source: the profile excerpts above, from the original Apache Doris post.
A documentation knowledge base answers questions about what the database can do. Performance troubleshooting is a different job. It needs a chain of evidence built from how the kernel behaves, and Doris Skills were designed for that job.
How do Doris Skills read a profile correctly?
Doris Skills is a library of decision rules built on Apache Doris kernel behavior. It turns the troubleshooting experience of senior DBAs into rules an agent can execute. doris-profile-reader rests on four ideas.
Counters are weighed by evidence value, not by size
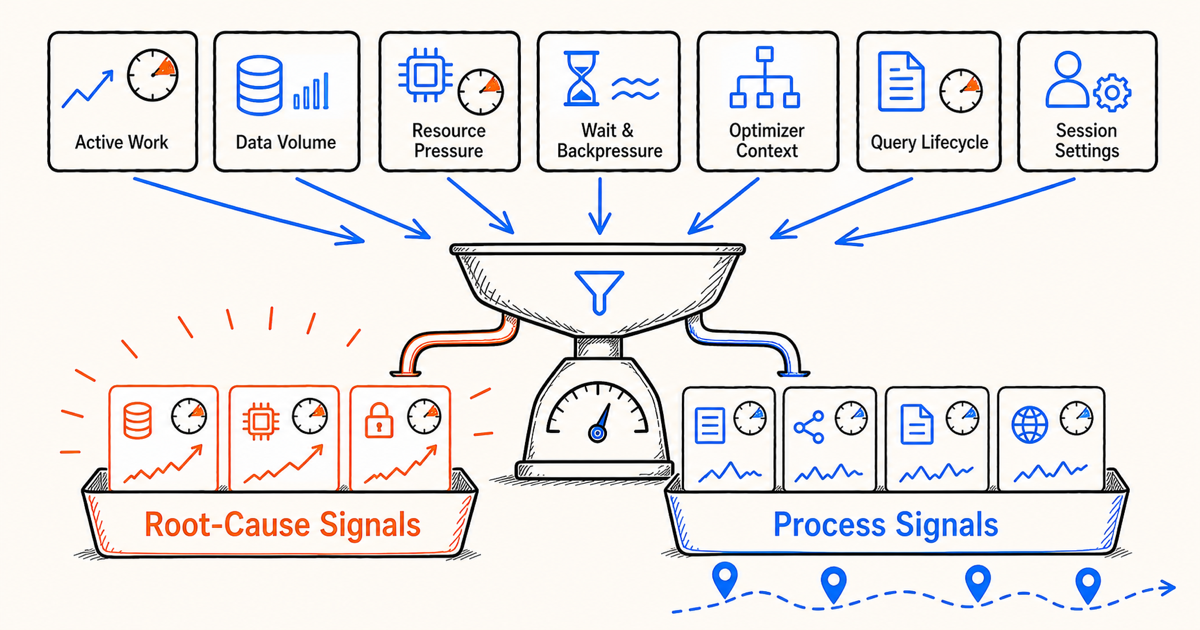
A profile contains dozens to hundreds of counters, and they carry very different diagnostic weight. ExecTime records an operator’s total time. WaitForData0 records the time the receiver spent waiting for upstream data. Subtract the second from the first and you get the operator’s own execution time.
doris-profile-reader groups counters into 7 categories and reduces them to 2 rules:
| Counter category | Rule | Diagnostic role |
|---|---|---|
| • Active work• Data volume• Resource pressure | Root cause signals | Counters that can directly support the conclusion "the bottleneck is here" |
| • Wait and backpressure• Optimizer context• Query lifecycle• Session settings | Process signals | Counters that explain the shape of the pipeline. They are waypoints on the causal chain that point somewhere else, never the endpoint |
Counter categories, rules and diagnostic roles.
Time counters are then analyzed in a fixed priority order: active timers (active work), then rows and bytes (data volume), then data skew (resource pressure), then queue and scheduling waits (waiting and backpressure).
Plan shape explains what runtime cost only locates
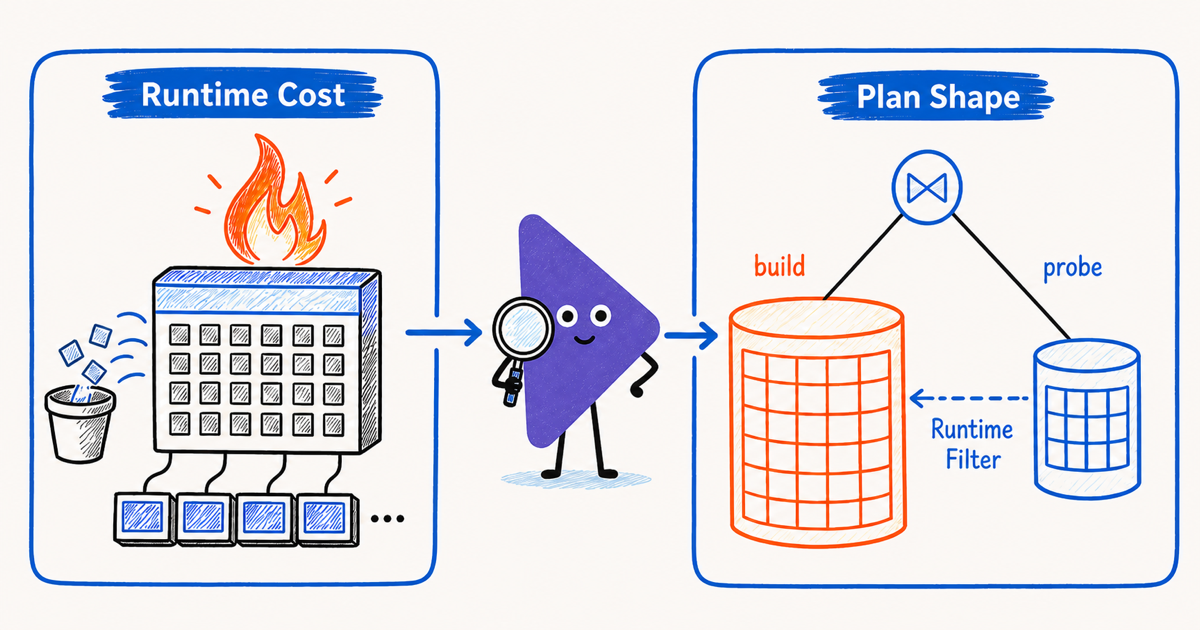
Finding the slowest operator keeps the diagnosis at the surface. A hash table build that takes too long usually traces back to a bad join order, such as the large table landing on the build side. Reporting only the operator time leads to advice like “add memory” or “enable spill”, which treats the symptom and leaves the cause in place.
The skill checks the shape of the join plan: which side is build and which is probe, where runtime filters are generated and where they are applied, and whether high selectivity branches are computed first.
Some misdiagnoses are subtle. One example is a full scan of a very large source table that exists only to produce a runtime filter with a high filter rate. For these, Doris Skills use a precedent mechanism: known misdiagnosis patterns are encoded as rule constraints, so the agent avoids recommendations that sound reasonable and still miss the root cause.
No conclusion until the investigation is complete
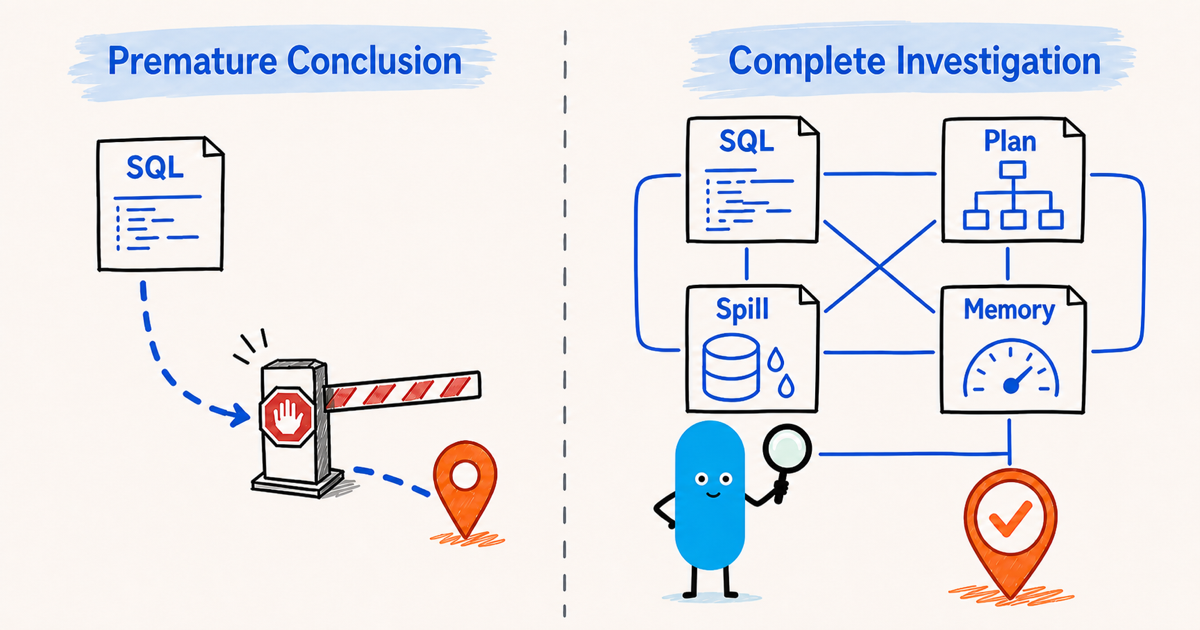
An AI that finds one suspicious point tends to stop there. Doris Skills add hard constraints: the agent may not output a qualitative conclusion until the required prerequisite checks are complete. Two examples:
- A slow insert may not be attributed to “too much data” until the SQL and physical plan have been checked for CPU heavy expressions such as SPLIT_BY_STRING or regex matching.
- An OOM may not be attributed to “join data expansion” until aggregation state size, expression materialization, spill status and the memory limit have been evaluated.
The same discipline runs through VeloDB Agent Skills, where a hard “do not recommend a fix before reading the profile” rule proved more reliable in evaluation than a soft “collect evidence first”.
Every conclusion carries a confidence grade
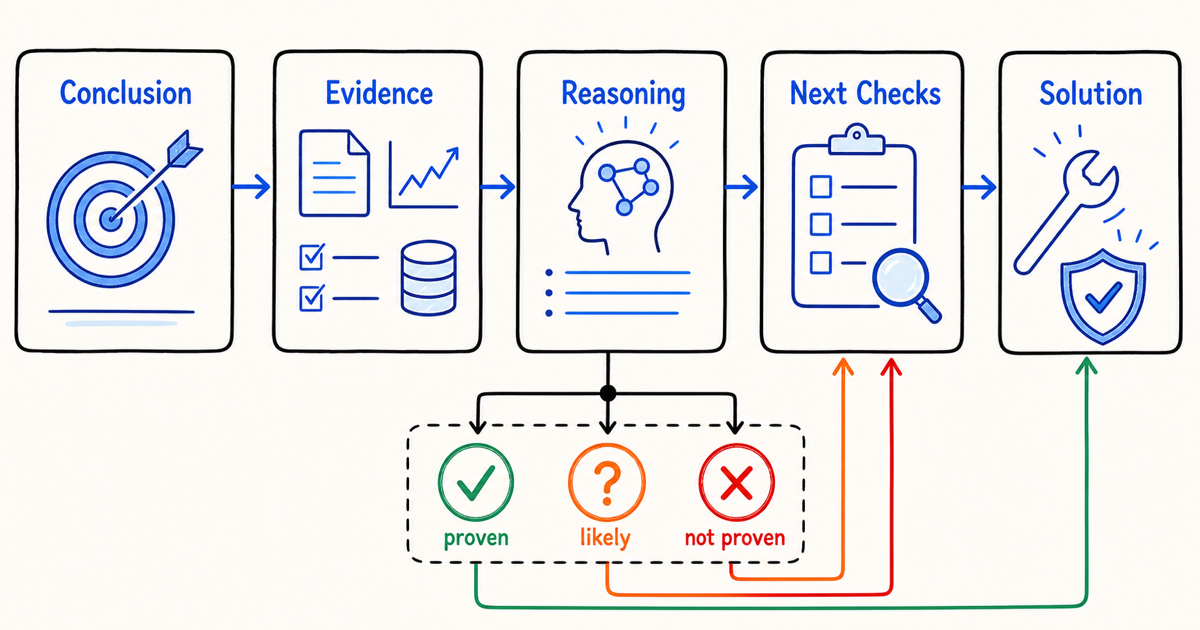
doris-profile-reader outputs every conclusion in one fixed format: Conclusion → Evidence → Reasoning → Next checks → Solution.
Every timing metric cited must carry its type and a confidence grade: proven, likely or not proven. A concrete fix is given only when the profile provides sufficient evidence or matches a known pattern exactly. When evidence is thin, the recommendation is demoted to Next checks, so the AI never presents a guess as a high confidence answer.
How do Doris Skills compare with VeloDB Agent Skills?
| Doris Skills (apache/doris-skills) | VeloDB Agent Skills (velodb/agent-skills) | |
|---|---|---|
| Audience | Open source Apache Doris users | VeloDB Cloud and VeloDB Enterprise users |
| Modules | doris-profile-reader, doris-best-practices, doris-architecture-advisor, doris-debug | velodb-architecture-advisor, velodb-best-practices (37 DDL rules), velocli-cloud |
| Profile analysis | Upload to the Profile diagnostic page, or run doris-profile-reader in your agent | VeloCLI commands (profile get, diff, history) read by velodb-best-practices |
| Cloud operations | Not included | velocli-cloud: cluster lifecycle, networking, billing, guarded destructive actions |
| Format | Open Agent Skills standard | Open Agent Skills standard, Apache 2.0 |
| Install | npx skills add apache/doris-skills | npx skills add velodb/agent-skills |
Sources: apache/doris-skills repository, velodb/agent-skills repository, VeloDB AI DevEx documentation.
When should you still read the profile yourself?
The skill encodes known patterns, and its precedent library is the limit of what it can call proven. A bottleneck that matches no precedent comes back graded likely or not proven with a list of next checks rather than a fix, which is the correct behavior and still means a person finishes the investigation. Profiles also have to exist before they can be read: profiling is off by default in Doris and has to be enabled for the session or query you want to diagnose. And the rules are written against current kernel behavior, so counter names and semantics that change between Doris releases land as updates in the repository. For a query that is slow for a reason nobody on the team has seen before, treat the report as a well organized first pass, not the last word.
How do you install Doris Skills?
The apache/doris-skills repository contains 4 modules:
-
doris-profile-reader: profile diagnosis and analysis
-
doris-best-practices: table design, capacity planning, and query optimization best practices
-
doris-architecture-advisor: architecture selection and evaluation based on your workload
-
doris-debug: production troubleshooting for queries, data loading, compaction, node status and materialized views
All 4 use the open Agent Skills format and work with Claude Code, Cursor, Windsurf and other agent frameworks and operations tools. Install them with one command:
npx skills add apache/doris-skills
VeloDB Cloud users can keep using VeloDB Agent Skills, which add VeloCLI based profile analysis and cloud operations on top of the same foundation:
npx skills add velodb/agent-skills
Frequently asked questions
-
What is a query profile in Apache Doris? A query profile is the execution record Doris produces for a query: every fragment, pipeline and operator, with counters for execution time, rows and bytes processed, memory used, and time spent waiting. It is the primary evidence for diagnosing a slow query. The Profile diagnostic page on doris.apache.org renders an uploaded profile as a plan graph and ranks the slowest operators.
-
Why is ExecTime sum larger than the total query time in a Doris profile? Doris runs an operator as many parallel instances. ExecTime sum adds up the time of every instance, so it measures total CPU work and will exceed wall clock time on any parallel operator. ExecTime max is the longest single instance and is the number to use for how long the operator actually blocked the query.
-
What does WaitForData0 mean in a Doris profile? WaitForData0 on an Exchange operator is the time the receiver spent waiting for the upstream operator to send data. A large value means the upstream operator is slow, not the Exchange or the network. In the example above, 11.9 seconds of WaitForData0 pointed to an 11.8 second hash join build one fragment upstream.
-
Do Doris Skills work with Claude Code, Cursor and other AI coding agents? Yes. Doris Skills use the open Agent Skills format, so npx skills add apache/doris-skills installs them into Claude Code, Cursor, Windsurf and other agents that support the standard. The same install path works for VeloDB Agent Skills.
-
What is the difference between Doris Skills and VeloDB Agent Skills? Doris Skills target open source Apache Doris and include profile reading, best practices, architecture advice and production debugging. VeloDB Agent Skills target VeloDB Cloud and add VeloCLI based diagnostics plus cloud operations with safety checks. Both are open source and share the same design discipline: evidence before conclusions, and no fix without reading the profile.