






Apache Doris analyzes dynamic JSON in agent logs with a fraction of the latency of alternatives. On the core dynamic JSON queries in AgentLogsBench at 100 million rows, ClickHouse runs at about 7.4x the median latency of Apache Doris, and Elasticsearch and OpenSearch at about 2.4x (geometric mean). The reason is VARIANT, the Doris data type that converts frequently queried JSON paths into typed columnar subcolumns, so filters and aggregations over an evolving payload execute like queries over ordinary columns.
Our previous post covered the design goals behind AgentLogsBench and the overall results. This post narrows to the queries most tied to dynamic JSON and VARIANT, and to what a system has to do internally when the payload keeps widening and the fields keep changing.
Key takeaways
-
At 100 million rows, Apache Doris delivered the lowest average latency on the JSON pata (Q07, Q10, Q12, Q16, Q17, Q18, Q20). ClickHouse’s average latency was about 7.4x that of Doris, while Elasticsearch and OpenSearch were about 2.4x that of Doris.
-
The widest single gap against ClickHouse is Q17, a high-cardinality filter on a dynamic request key: 0.032s for Doris against 2.339s for ClickHouse, roughly 70x on one debugging step.
-
Elasticsearch stays competitive on search-plus-rollup queries: 0.989s on Q19 against 1.013s for Doris. ClickHouse takes 30.816s on the same query.
-
Storage at 100 million rows: ClickHouse 53.8 GB, Doris 62.2 GB, Elasticsearch 191.9 GB, OpenSearch 194.7 GB. Doris lands within 16% of ClickHouse while also serving full-text search.
-
The mechanism behind the Apache Doris numbers: VARIANT sub-columnizes hot JSON paths into typed columns and routes the long tail into sparse columns or DOC mode, so hot-path queries never pay for thousands of fields they did not ask for.
The shape of logs produced by agents
AI agent logs keep getting wider; a log entry used to carry a timestamp, a level, and a message. A single agent call now carries model parameters, tool invocations, retrieval results, prompt versions, user context, and whatever else the framework decided to emit that week. You cannot design a schema for fields like these ahead of time, so JSON becomes the natural container.
A single user request fans out into a trace. The agent plans, calls a model, gets back a stop reason and a token count, invokes a tool, receives an exit code and a stderr blob, runs a retrieval step, scores the results, calls the model again, and answers. Every hop emits an observation.
Some fields on that observation are stable. Trace ID, timestamp, latency, cost, and event type appear on every row, so they belong in real columns where they can be indexed, filtered, and aggregated.
The rest keep moving, and they land in the payload (abridged):
{
  "event_time": "2026-04-01T12:00:00Z",
  "trace_id": "trace_000001",
  ...
  "payload": {
   "provider": {
    "stop_reason": "tool_use",
    "cache_hit": false
   },
   "tool_result": {
    "stderr": "unable to open ...",
    "exit_code": 1
   },
   "otel": {
    "status_code": "ERROR"
   }
  }
 }
Payload contents change on a schedule nobody controls. A model provider adds a field. A framework upgrade renames one. A customer enables a plugin that emits 12 of its own. A new workflow variant ships with a prompt template ID nobody has seen before. Across every model, tool, plugin, customer configuration, and release ring in production, a payload that started with 30 fields can carry several thousand within a quarter.
Debugging and analysis still have to respond in milliseconds while that happens. The question this post answers: once a payload grows from a few dozen fields to a few hundred or a few thousand, can the database still analyze those dynamic fields as fast as it analyzes ordinary columns?
How AgentLogsBench measures JSON processing efficiency
AgentLogsBench, a benchmark designed for real-world agentic workload measures how efficiently a database processes dynamic JSON under an agent observability workload. It generates a dataset of agent observations, loads it into each system, and runs the same queries against all of them.
Every system in this comparison supports JSON, and that one label covers designs that behave nothing alike: some store a string and parse it on read, others shred paths into typed columns at write time. A feature matrix shows the same checkbox for both designs, so AgentLogsBench measures the difference directly.
To keep the comparisons fair and unbiased, we established the following ground rules:
Every system queries one table. All queries run against a single agent_observations table. No system may pre-flatten the JSON into columns, split fields into helper tables, or predefine every possible path before load. Those shortcuts let a system opt out of the dynamic schema problem, which is the problem under test.
The queries follow real debugging behavior. They filter on evolving payload.attr paths, aggregate provider stop reasons, facet on dynamic fields, roll up prompt template versions, and combine text search with aggregation. Fields change as models, tools, frameworks, customer configurations, and workflows evolve, and the query set is built to change with them.
The main run uses 100 million rows and reports median latency per query. All systems run on the same single-node environment: an AWS m6i.8xlarge instance (32 vCPU, 128 GiB memory, gp3 SSD) on Ubuntu 24.04, with Apache Doris 4.1.0-rc01, ClickHouse 26.2.13.2, Elasticsearch 9.3.0, and OpenSearch 3.6.0.
Why does query latency decide this workload?
Agent observability is interactive work in which a user waits for answers. When an agent produces a wrong response, an SRE or engineer needs to perform a root cause analysis like a regular issue; he/she will open the trace view, filter to that window, narrow to the affected model version, group by tool exit code, spots a spike in one release ring, and drills into a specific prompt template. Each step is a query, and one debugging session runs a dozen or more of them.
At 300 milliseconds per query, the debugging session feels like a conversation with the data. At 3 seconds, it feels like running reports, and engineers’ velocity massively decreases
Latency compounds in this workload for three reasons:
-
Debugging is sequential. Each query depends on what the previous one showed, so latency adds up across the session instead of parallelizing away.
-
Evaluation loops run constantly. Agent teams score prompt versions, model versions, tool success rates, and cost per workflow on every release. Those rollups hit the same dynamic fields, on schedules and on demand.
-
Dashboards fan out. One incident page can fire 15 aggregations at once, and the slowest sets the page load time.
Storage size sets what a team pays to retain a quarter of traces, and we report it below. Query latency sets whether anyone opens the agent observability tool at all.
Query latency on the dynamic JSON query set
Taking the geometric mean across the JSON path set (Q07, Q10, Q12, Q16, Q17, Q18, Q20) at 100 million rows, ClickHouse runs at about 7.4x the latency of Doris, and Elasticsearch and OpenSearch at about 2.4x. The table below breaks out the queries most tied to VARIANT and JSON path access for the four systems most relevant to the comparison; the full public results also include DuckDB and PostgreSQL.
| Query | Scenario | Doris | ClickHouse | Elasticsearch | OpenSearch |
|---|---|---|---|---|---|
| Q07 | Multi-condition filter on evolving payload.attr | 1.497s | 2.904s | 1.800s | 1.819s |
| Q10 | Provider stop reason and cache hit aggregation | 0.315s | 2.448s | 1.959s | 2.071s |
| Q12 | Dynamic field facet aggregation | 0.570s | 2.656s | 1.218s | 1.259s |
| Q16 | Multi-condition filter on low-cardinality fields | 0.113s | 2.715s | 0.810s | 0.768s |
| Q17 | High-cardinality request key filter | 0.032s | 2.339s | 0.057s | 0.053s |
| Q18 | Prompt template version performance rollup | 1.169s | 2.760s | 1.114s | 1.155s |
| Q19 | Incident rollup plus text token | 1.013s | 30.816s | 0.989s | 1.333s |
| Q20 | Workflow and policy pack rollup | 0.629s | 2.592s | 1.359s | 1.508s |
Median latency at 100M rows. Lower is better.
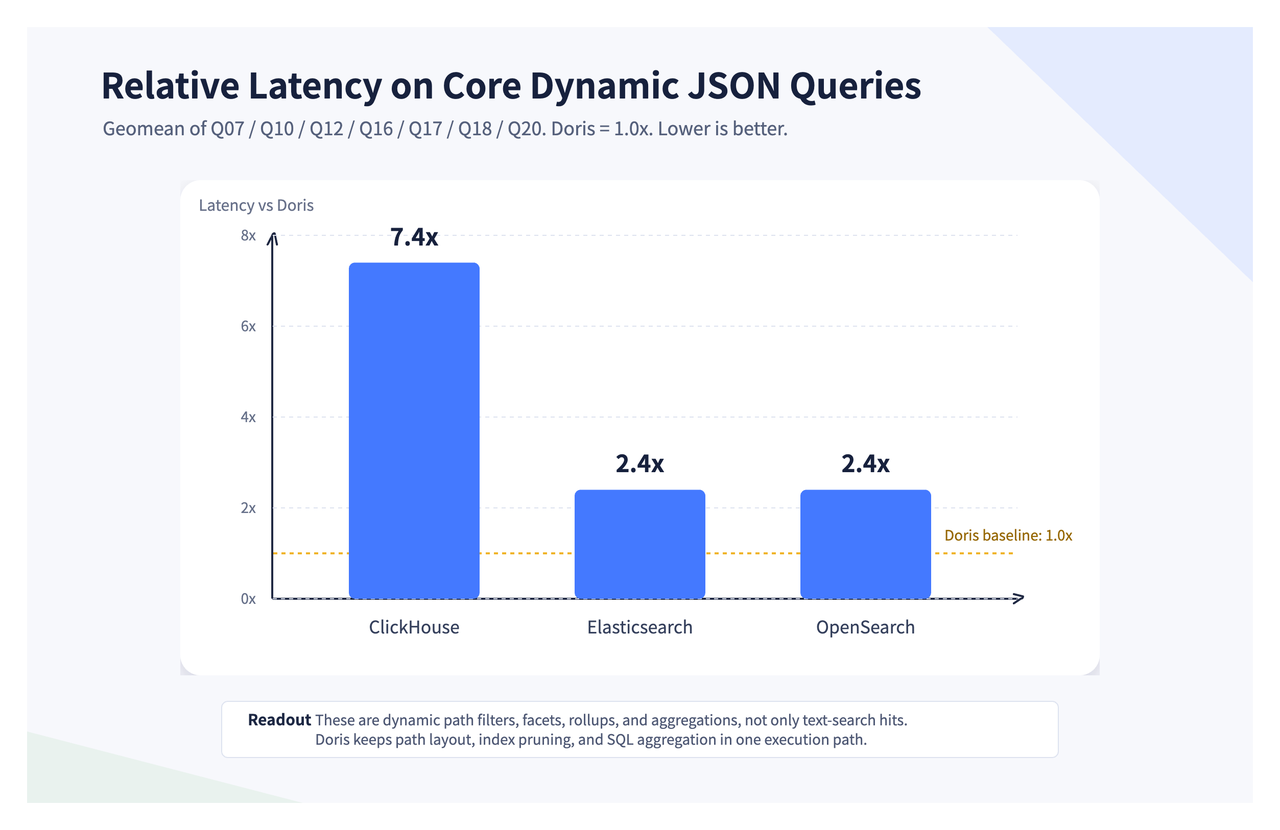
Relative latency on core dynamic JSON queries, geometric mean, Doris = 1.0x.
Three things stand out:
-
Elasticsearch and OpenSearch hold their own on search. Q19 combines a text token match with a rollup, and Elasticsearch finishes in 0.989s against Doris at 1.013s. Q18 is similarly close.
-
ClickHouse compresses well and pays for it on dynamic paths. Its latency sits between 2.3s and 2.9s on nearly every query in the set, and Q19 costs it 30.816s.
-
Apache Doris leads by the widest margins on dynamic field work. Q10, Q12, Q16, and Q20 are aggregations, facets, and rollups over payload fields, and Doris finishes them in 0.113s to 0.629s.
That payload aggregation group (Q10, Q12, Q16, Q20) is where the practical difference lives. In agent observability, search is the first step. Once an engineer finds the anomalous traces, the analysis starts: filter by payload field, count the error distribution, compare prompts, compare model versions, compare release rings and customer tiers. Q17 shows the size of the gap. A high-cardinality filter on a dynamic request key takes Doris 0.032s and ClickHouse 2.339s, roughly 70x on a single step of a debugging session.
Storage footprint at 100 million rows
Doris stores the 100-million-row dataset in 62.2 GB on disk, within 16% of ClickHouse at 53.8 GB and roughly one third of Elasticsearch and OpenSearch at 191.9 GB and 194.7 GB.
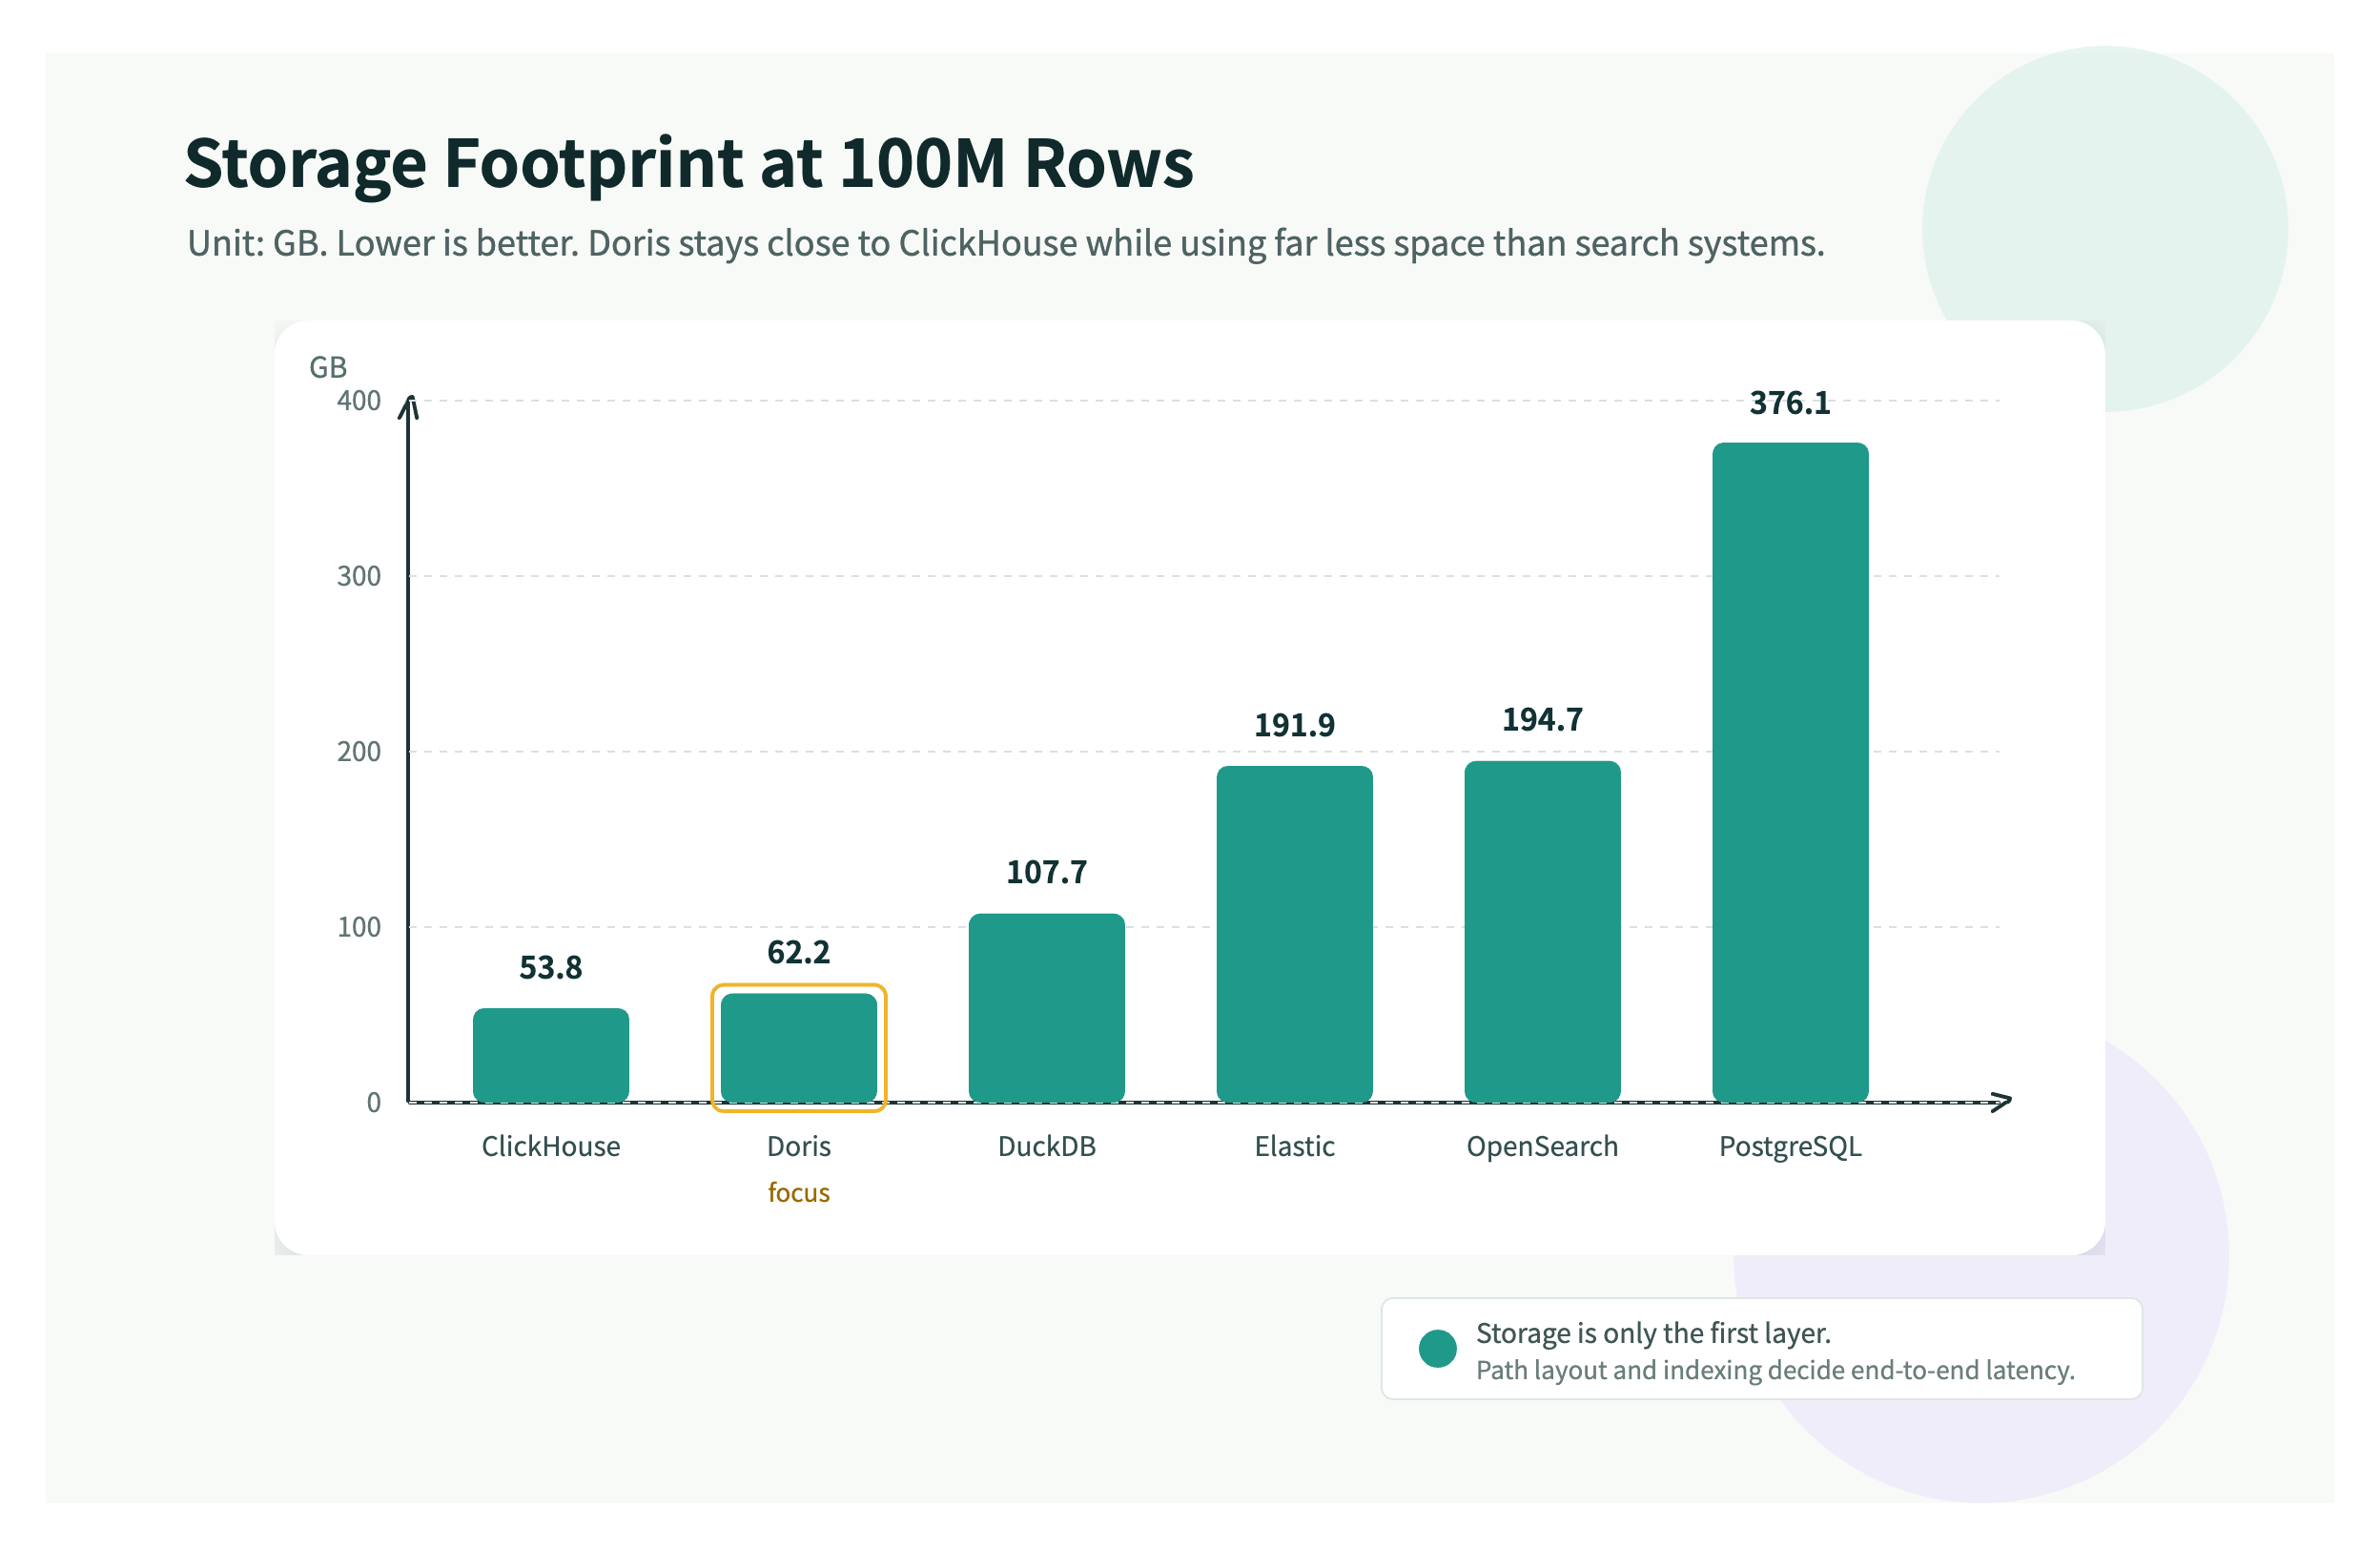
On-disk storage footprint at 100M rows, in GB. Lower is better.
-
ClickHouse uses the least space at 53.8 GB, consistent with its columnar compression.
-
Elasticsearch and OpenSearch use considerably more, at 191.9 GB and 194.7 GB, because they maintain inverted indexes, term dictionaries, and the structures phrase queries depend on.
-
Apache Doris lands at 62.2 GB while serving full-text search and dynamic payload queries together.
A mixed-workload system usually pays for that combination in either slow search or bloated storage. Doris keeps VARIANT, inverted indexes, SQL aggregation, and caching inside one columnar engine, which is why it avoids paying either price in full.
Doris VARIANT: pulling dynamic JSON into the columnar execution path
From JSON path to columnar subcolumns
Doris VARIANT converts frequently used JSON paths into internal columnar subcolumns. That conversion drives the results above.
On write, Doris parses the JSON paths, infers types, and subcolumnizes. On read, you still write plain JSON path expressions. Here is Q12 in simplified form:
SELECT
    CAST(payload['attr']['release_ring'] AS STRING) AS release_ring,
    CAST(payload['attr']['customer_tier'] AS STRING) AS customer_tier,
    count(*) AS observations,
    avg(latency_ms) AS avg_latency_ms,
    sum(total_cost) AS total_cost
FROM agent_observations
WHERE type IN ('GENERATION', 'TOOL', 'RETRIEVAL')
GROUP BY
    CAST(payload['attr']['release_ring'] AS STRING),
    CAST(payload['attr']['customer_tier'] AS STRING)
ORDER BY observations DESC
LIMIT 50;
Underneath, the executor resolves that query against columnar storage. This is why Q12 finishes in 0.570s. The query reads like a scan over payload, and it executes as a read over two typed subcolumns, with column pruning, vectorized execution, dictionary encoding and compression, and index-based filtering all available.
A traditional JSON query searches for fields inside one large document over and over. VARIANT lifts the frequently accessed paths out at write time and gives them the query characteristics of ordinary columns.
The bottleneck in wide JSON: hot paths mixed with the long tail
Agent log payloads only get wider, and the width is uneven. A handful of paths become hot, queried in nearly every session:
payload.attr.release_ring
payload.attr.customer_tier
payload.provider.cache_hit
payload.provider.stop_reason
Thousands more sit in the long tail, arriving from different models, tools, plugins, customer configurations, and workflows, and getting queried once a month.
A system that treats every path identically runs into a predictable problem: a query touching 4 hot fields gets dragged down by thousands of long-tail fields it never asked for.
Doris handles the two tiers differently. High-frequency paths become columns. Low-frequency paths go into sparse columns or DOC mode. For wide JSON workloads we recommend Storage Format V3, which decouples column metadata from the segment footer when VARIANT generates a large number of dynamic subcolumns. Files open faster, memory overhead drops, and hot fields keep the low latency of ordinary columns.
How other systems handle dynamic JSON
DuckDB and Parquet Variant: strong open format, limited online analytics
Parquet Variant and DuckDB Variant are strongest as open formats. They move semi-structured data from JSON strings to a typed binary representation and support shredding high-frequency fields into strongly typed columns, which suits lakehouse interchange, local analysis, and cross-engine read and write.
On the 100M-row run, DuckDB latency on the core queries ranged from 282.798s to 7414.692s, against 0.032s to 1.497s for Doris. The two designs answer different questions. Open file formats answer how to store semi-structured data portably. Doris VARIANT answers how an online analytics system folds dynamic JSON into columnar storage, indexing, compaction, and vectorized execution.
Elasticsearch and OpenSearch: strong search, expensive dynamic aggregation
Search is where Elasticsearch and OpenSearch shine, and Q17 and Q19 show it. Dynamic mapping, however, is sensitive to field explosion. Agent log payloads generate a long tail by nature: payload.attr., payload.tool_result., payload.otel.*, framework-private fields, plugin fields. Map all of them as aggregatable and the cost climbs across mapping, doc values, heap, and segment metadata.
The search capability holds up well. The cost arrives afterward, in multi-dimensional aggregation, dynamic field analysis, and low-cost long-term retention.
ClickHouse JSON: excellent compression, real cost on long-tail paths
The ClickHouse JSON type already supports subcolumns, and shared data handling continues to improve. Once dynamic paths exceed the configured limit (max_dynamic_paths, 1024 by default), long-tail paths fall through to shared data, and querying them usually means extra reads and filtering.
Version 25.8 introduced bucketed and advanced shared data serialization, letting ClickHouse skip more precisely to a specific path’s data instead of reading unrelated substreams. That design carries its own cost: reading full JSON or merging can slow down, so ClickHouse keeps an additional copy in the original format to balance compatibility against efficiency, which adds storage overhead.
One table: how each system understands JSON
| System | How it models JSON | Strength | Main cost |
|---|---|---|---|
| Doris | Database-native columnar VARIANT | Dynamic field filtering, SQL aggregation, and full-text search working together | Storage is low but not the absolute minimum |
| ClickHouse | Dynamic subcolumns plus shared data | Strong compression, mature columnar analytics | Shared data path queries cost more |
| Elasticsearch / OpenSearch | Search documents and inverted indexes | Full-text search, document recall, high-cardinality filters | Field explosion and aggregation cost |
| DuckDB / Parquet Variant | Open file format with a local analytics layer | Lakehouse interchange, local analysis, open encoding | Limited online wide-JSON analytics |
| PostgreSQL JSONB | Row-stored JSON documents | Broad applicability, mature ecosystem | Constrained at large-scale interactive analytics |
Apache Doris absorbs dynamic JSON into its own columnar storage, indexing, and file format. The other systems work within the boundaries they started from: a search index, an open file format, or a row-stored JSON document.
Choosing a datastore for agent traces
The 7.4x spread in AgentLogsBench comes from each system’s architectural approach to dynamic JSON. Individual JSON function performance explains very little of it.
In agent observability, payloads keep widening and fields keep evolving, while query hot spots stay concentrated on a small set of business-critical paths. Whether a system can pull those dynamic paths into columnar storage, indexing, compression, and vectorized execution determines what the analysis experience feels like after the search returns.
Two things follow for anyone choosing a store for agent traces. Search performance and post-search performance are separate questions, and a system strong at the first can be expensive at the second. And payloads widen faster than teams plan for while hot paths stay few, so the storage layer should treat those two tiers differently from the start.
That is where the Apache Doris advantage originates. VARIANT turns dynamic fields into columnar structures you can prune, index, and aggregate. For AI agent logs, event analytics, and RAG or agent trace analysis, that capability keeps getting more important as agents grow more autonomous and emit more per request. For a production example at petabyte scale, see how StepFun built its agent observability platform with Apache Doris.
If you want to run Apache Doris fully managed, VeloDB Cloud gives you the same VARIANT, inverted index, and caching capabilities that produced these benchmark results.