






Engineers dealing with large-scale observability systems have long suffered from a database paradigm dilemma when trying to perform root cause analysis
When an incident breaks out in production, you usually need to do two things immediately:
-
Search unstructured text: Find specific log signatures such as "out of memory", stack traces, or exception codes using Lucene search
-
Compute quantitative metrics: Calculate affected user counts, aggregated error rates, and P99 latency curves across services using SQL
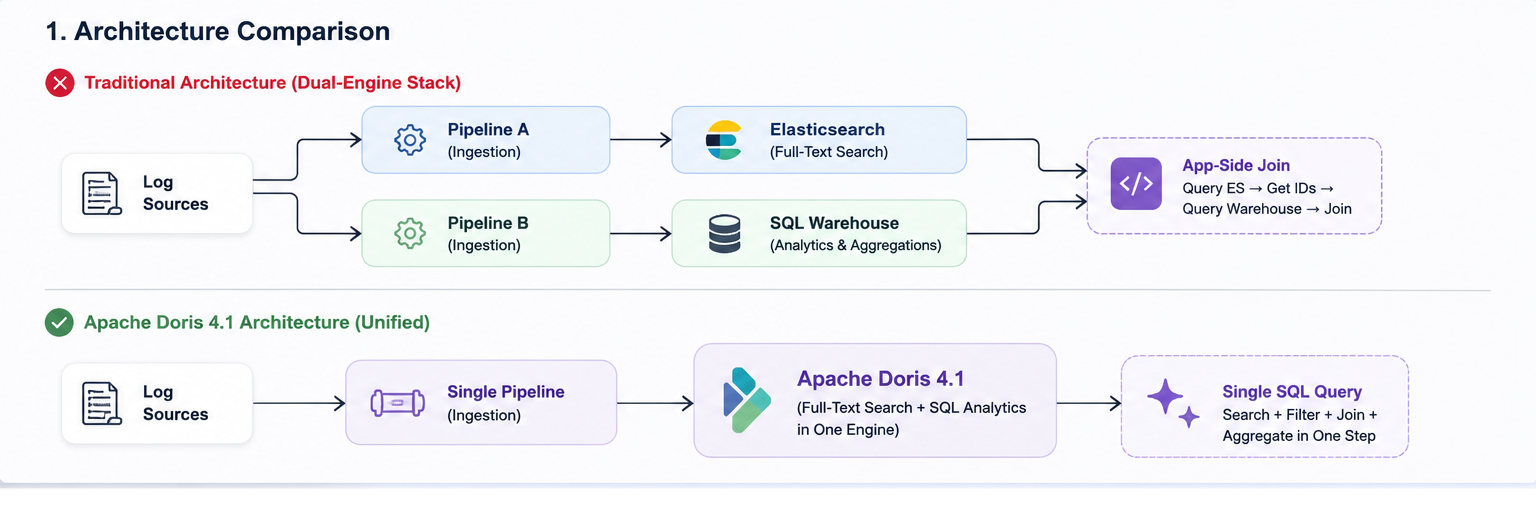
Traditionally, standard relational databases struggled with full-text search, and search engines struggled with complex aggregations; as a result, engineering teams built dual-stack architectures. Engineering teams were forced into a multi-step query workflow: running full-text searches in a dedicated search cluster to extract matching log IDs, then feeding those IDs into an OLAP warehouse to compute metrics
VeloDB simplifies working with text data in SQL through its native search() function alongside its integrated inverted index subsystem. Rather than juggling separate tools or syntax workarounds, VeloDB lets you write intuitive full-text search conditions directly inside standard SQL analytical queries.
Recap on the Hidden Costs of the Dual-Engine Stack
Maintaining a dedicated search cluster alongside an OLAP warehouse introduces substantial operational friction:
-
High Storage Overhead: Elasticsearch relies on forward indexes and uncompressed text structures, typically yielding a low compression ratio around 1.5x. Columnar engines like Apache Doris achieve 5x to 10x compression using algorithms like Zstandard.
-
Ingestion Tax and Pipeline Drift: Data must be written into two separate clusters via dual pipelines. Synchronization delays mean search results in Elasticsearch rarely align perfectly with warehouse metrics.
-
Application Glue Code: To join search results with numerical metrics, application developers must write custom code to query Elasticsearch for document IDs, extract those IDs, and execute an
IN (...)SQL query in the warehouse.
Under the Hood: How search() Executes Inside Doris 4.1
The search() function is not a simple string wrapper around LIKE or regex operators. It is built directly on top of Doris's native inverted index subsystem (powered by an embedded C++ CLucene core).
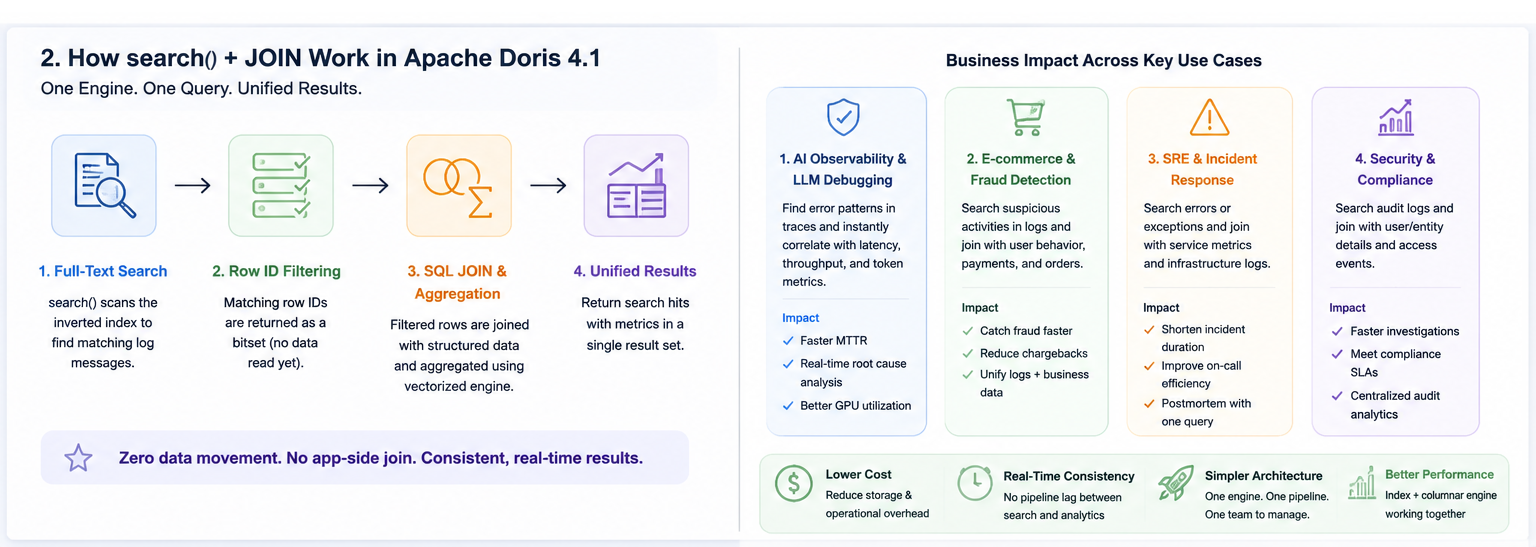
Here is how the query engine processes a search() call during query execution:
-
Co-located Index Storage: When log data is written into Doris, the engine generates segment files. Alongside each data segment, an inverted index
.idxfile is constructed. The index lives next to the columnar data, following the exact same compaction and storage tiering lifecycle. -
Unified Query Compilation: When Doris parses
search(log_message, 'PHRASE("out of memory") OR REGEXP("CUDA.*")'), the Nereids query optimizer compiles all conditions into a single Lucene AST (Abstract Syntax Tree) scorer. Instead of evaluating multiple predicates separately and intersecting bitmaps manually, the engine evaluates the full expression tree in a unified pass. -
Zero-IO Bitset Pushdown: The posting lists (row ID mappings) returned by the index filter down the row set before data reading begins. Unmatched rows are never read from disk or decompressed in memory.
-
Vectorized BM25 Scoring: If your query includes
search_score(), Doris calculates BM25 relevance rankings across the surviving row set using vectorized SIMD execution.
What the syntax looks like for some common use cases
AI Observability and LLM Infrastructure Debugging
Large Language Model (LLM) serving platforms generate high volumes of unstructured trace logs alongside structured token and latency metrics. When GPU nodes run out of VRAM or time out, operators need to isolate failing models and assess user impact immediately.
Table DDL
SQL
CREATE TABLE ai_inference_logs (
    log_time DATETIME NOT NULL,
    trace_id VARCHAR(64),
    model_name VARCHAR(64),
    prompt_tokens INT,
    completion_tokens INT,
    latency_ms INT,
    log_message STRING,
    INDEX idx_log_message (log_message) USING INVERTED PROPERTIES("parser" = "unicode")
)
ENGINE = OLAP
DUPLICATE KEY(log_time, trace_id)
PARTITION BY RANGE(log_time) ()
DISTRIBUTED BY HASH(trace_id) BUCKETS 16;
One query finds the failing models, quantifies the damage, and pulls a representative error, all in a single scan:
SELECT
    model_name,
    COUNT(*) AS total_errors,
    PERCENTILE(latency_ms, 0.99) AS p99_latency_ms,
    AVG(prompt_tokens + completion_tokens) AS avg_tokens_per_request,
    MAX(search_score()) AS max_relevance_score,
    MAX_BY(log_message, search_score()) AS representative_error_sample
FROM ai_inference_logs
WHERE
    log_time >= NOW() - INTERVAL 2 HOUR
    AND model_name IN ('llama-3-70b', 'mistral-large')
    AND search(log_message, 'PHRASE("out of memory") OR REGEXP("CUDA.*error") OR WILDCARD("timeout*")')
GROUP BY model_name
ORDER BY total_errors DESC;
Technical Execution Analysis
-
Full-Text Matching: The
search()clause identifies log messages containing exact phrase hits, regular expressions, or wildcards. -
Statistical Aggregation: The query calculates real-time P99 latency (
QUANTILE_PERCENT) and token usage averages (AVG) across matching log records in the same scanning phase. -
Contextual Extraction: The
MIN_BY(log_message, search_score())function identifies and extracts the exact log message that scored highest under the BM25 algorithm, giving engineers immediate diagnostic context.
Use Case 2: Cybersecurity & SIEM Threat Hunting
Security Operations Centers (SOC) process hundreds of thousands of firewall, auth, and network events per second. Threat hunters must correlate text search patterns (like brute force login failures) with IP-level activity metrics.
Doris indexes both the structured and the unstructured columns:
CREATE TABLE security_audit_logs (
    event_time DATETIME NOT NULL,
    source_ip VARCHAR(45),
    user_id VARCHAR(64),
    action VARCHAR(32),
    status_code INT,
    raw_event STRING,
    INDEX idx_raw_event (raw_event) USING INVERTED PROPERTIES("parser" = "unicode"),
    INDEX idx_source_ip (source_ip) USING INVERTED
)
ENGINE = OLAP
DUPLICATE KEY(event_time, source_ip)
PARTITION BY RANGE(event_time) ()
DISTRIBUTED BY HASH(source_ip) BUCKETS 32;
Threat Hunting Query
SELECT
    source_ip,
    COUNT(*) AS total_suspicious_events,
    COUNT(DISTINCT user_id) AS targeted_account_count,
    MAX(search_score()) AS highest_threat_score,
    GROUP_CONCAT(DISTINCT action) AS observed_actions
FROM security_audit_logs
WHERE
    event_time >= NOW() - INTERVAL 15 MINUTE
    AND search(raw_event, 'PHRASE("failed password") OR TERM("UNAUTHORIZED_ACCESS") OR REGEXP("sudo.*denied")')
GROUP BY source_ip
HAVING total_suspicious_events > 20
ORDER BY total_suspicious_events DESC;
Technical Execution Analysis
-
Compound Index Utilization: Doris uses inverted indexes on both structured (
source_ip) and unstructured (raw_event) text columns. -
High-Throughput Filtering: Billions of audit logs are pruned in milliseconds via bitmap intersections on the inverted index posting lists.
-
Behavioral Grouping: The
HAVINGclause isolates specific IP addresses conducting distributed brute-force attacks across multiple accounts simultaneously.
Use Case 3: E-Commerce Product Search & Business Intelligence
Merchandising teams want to tie search behavior to money. The recurring question: when customers search for a specific product trait, what is the conversion and revenue impact?
CREATE TABLE product_catalog_events (
    event_time DATETIME NOT NULL,
    category_id INT,
    brand_id INT,
    price DECIMAL(10, 2),
    sales_count INT,
    product_description STRING,
    INDEX idx_desc (product_description) USING INVERTED PROPERTIES("parser" = "english")
)
ENGINE = OLAP
DUPLICATE KEY(event_time, category_id)
PARTITION BY RANGE(event_time) ()
DISTRIBUTED BY HASH(category_id) BUCKETS 16;
Unified Product Search and Revenue Query
Search and revenue come back together in one result:
SELECT
    brand_id,
    COUNT(*) AS matching_product_count,
    AVG(price) AS average_price,
    SUM(sales_count * price) AS total_revenue_generated,
    MAX_BY(product_description, search_score()) AS top_matching_product
FROM product_catalog_events
WHERE
    search(product_description, 'PHRASE("noise cancelling") AND WILDCARD("wireless*")')
    AND price BETWEEN 50.00 AND 300.00
GROUP BY brand_id
ORDER BY total_revenue_generated DESC;
Technical Execution Analysis
-
Language-aware parsing: the english analyzer handles stemming and case normalization on the descriptions.
-
Hybrid range and text filtering: the numeric predicate (price BETWEEN 50 AND 300) combines with the full-text rules in the same planner pass.
-
Immediate financial insight: revenue and sales totals are computed in the same scan as the search, so there is nothing to export and reconcile elsewhere.
Best Practices for Log Indexing in Apache Doris 4.1
Transitioning to a unified log platform offers immense efficiency gains, but getting the absolute highest performance out of Apache Doris 4.1 requires a few smart configuration choices.
To ensure your log queries execute in milliseconds even as your data volume grows into hundreds of terabytes, keep the following guidelines in mind:
-
Select the Appropriate Text Parser: Choosing the right tokenizer determines how effectively your text is indexed. You should use the
unicodeorstandardparser for general multilingual system logs. If your workload involves domain-specific text, choose language-tailored options likeenglishorchinese. For strict identifiers liketrace_idoruser_id, set the parser tononeso that Doris performs exact keyword matching without splitting strings into separate tokens. -
Partition Tables Intentionally by Time: Always set up your tables using
PARTITION BY RANGE(log_time). When you organize data by time ranges, the query planner performs automatic partition pruning. This means Doris eliminates irrelevant historical folders from disk before it even checks the inverted index posting lists. -
Leverage Storage Tiering to Control Costs: You can significantly lower your infrastructure spend by automatically shifting older data to cheaper storage tiers. Configure Doris to keep hot logs on fast local SSDs for initial troubleshooting, while automatically moving logs older than 7 or 30 days to cloud object stores such as Amazon S3 or HDFS. Doris continues to query this cold storage transparently whenever historical audits require it.
Summary: The Future of Log Analytics
Managing separate systems for log search and numerical analytics has long been a workaround forced by database limitations. By embedding native inverted indexes directly into VeloDB's vectorized query engine, you can run text searches and complex SQL aggregations in a single query.
This means simpler architecture, lower storage costs, and no custom app-side glue code during an active incident. With VeloDB, teams can diagnose root causes faster using the standard SQL toolchain they already know.
Join the Apache Doris community on Slack and connect with other Doris experts and users. If you're looking for a fully managed Apache Doris cloud service, contact the VeloDB team.