Why Agent Observability Matters Now
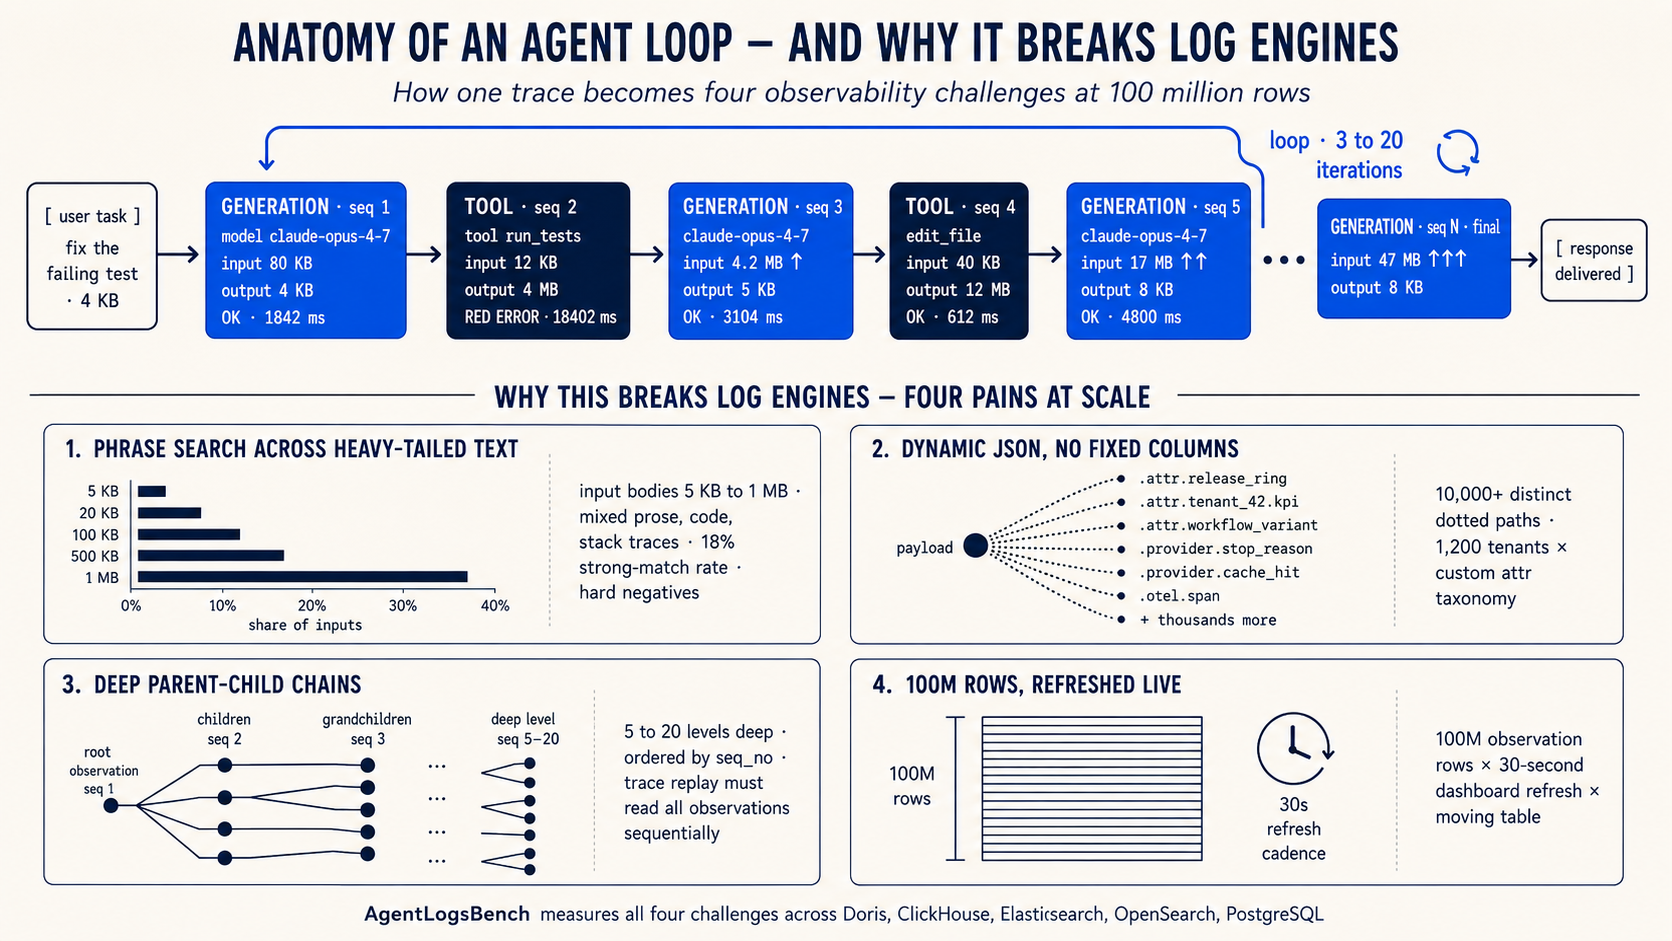
A coding agent goes into a loop. It tries to fix one failing test by editing the same file again and again, calls the same tools repeatedly, burns through tokens, and still returns a broken patch. The platform team has minutes to answer: is this one trace, one model version, one prompt template, one customer tier, or a system-wide failure?
That question is not hypothetical. As AI agents move from demos to production, every platform team faces it. Agents generate traces that are longer, more complex, and more deeply nested than anything traditional observability was built for. The teams running these agents need to search, filter, replay, and monitor those traces in real time. The tooling that worked for request-response services does not keep up.
How Agentic Observability Differs from Traditional Observability
Traditional observability tracks structured, predictable telemetry: HTTP status codes, latency percentiles, error counts. The schema is stable. The payloads are small. A metrics dashboard and a log search tool cover most operational questions.
Agent observability breaks those assumptions in four ways.
Text bodies are large and unstructured. A single model turn can produce 5 KB to 1 MB of output that mixes natural language with code, file paths, stack traces, and JSON fragments. Failure signatures like "timeout awaiting headers" or "retry budget depleted" hide inside these bodies. Finding them requires phrase search over multi-KB text, not simple string matching on short log lines.
Schemas are dynamic. The attributes that matter during incident review (model version, prompt template, release ring, customer tier, retrieval strategy) live in a dynamic JSON payload, not in fixed columns. Different tenants, tools, and model providers each contribute their own attributes. One payload column can carry hundreds of distinct shapes within a single table. Pre-flattening every path into helper tables turns observability into an ETL project.
Traces are sequential, not flat. A trace is not one row of text but a sequence of observations: model turns, tool calls, retries, and intermediate context. Operators need every observation in execution order, and they often need to search inside nested payload fields like payload.tool_result.stderr while replaying the chain.
Dashboards run against the same moving table. While the team investigates, cost, latency, failure rate, and tool usage panels keep refreshing. The operator expects those panels to redraw in tens of milliseconds even while ingest writes new rows.
Four Access Patterns That Define the Workload
These four differences map directly to four access patterns that any agent observability system must handle simultaneously:
-
Phrase search over agent text. Find failure signatures buried in large input and output bodies, scoped by tenant and time.
-
Filters on dynamic JSON. Slice by any attribute in the payload (release ring, model version, stop reason) without schema migration.
-
Ordered trace replay. Fetch every observation for a trace in execution order and reconstruct the call tree.
-
Live dashboard refreshes. Aggregate cost, latency, and failure rate against a table that is still accepting writes.
No single traditional tool covers all four. Search engines handle phrase search but struggle with analytical aggregations. OLAP databases handle dashboards but lack text search. Document stores handle dynamic JSON but cannot replay traces efficiently. Agent observability demands all four in one system, over one table.
How AgentLogsBench Measures What Matters
AgentLogsBench is a benchmark designed around these four access patterns. Instead of testing isolated primitives (how fast can you scan a column, how fast can you index text), it tests the mixed workload that agent platforms actually run: replay a trace, search for a failure phrase, filter by a dynamic attribute, and refresh a dashboard, all against the same observation table.
The benchmark lives in the velodb/agentlogsbench repository and compares Apache Doris, ClickHouse, DuckDB, Elasticsearch, OpenSearch, and PostgreSQL on one shared workload. VeloDB, the company behind Apache Doris, publishes the benchmark. The workload, queries, schemas, and result artifacts are all open in the repository, so anyone can audit and rerun them. The live leaderboard is at https://velodb.github.io/agentlogsbench/.
Dataset
The scored surface is one primary table, agent_observations. The schema promotes stable fields (trace_id, seq_no, event_time, tenant, model, tool_name, input, output, token counts, cost, and latency) to columns. Everything else lives in a dynamic payload carrying tracing-standard fields, model provider metadata, and long-tail attr.* fields.
That single-table design is the benchmark's most important constraint: it prevents an engine from winning by pre-flattening every JSON path into helper tables or by splitting text search and analytics into separate systems.
The data is synthetic but seed-driven from coding-agent traces, with input bodies ranging from 5 KB to 1 MB. The dataset injects strong target keywords into 18% of rows, alongside lookalike phrases that should not match. A query that scans for any substring will overcount. The benchmark defines three scale tiers; this post uses the M tier (roughly 100 million rows).
| Tier | Purpose | Observation rows |
|---|---|---|
| S | Development and CI | 10M-30M |
| M | Official leaderboard | 100M-300M |
Query Suite
The benchmark uses 20 fixed queries grouped by the four access patterns:
| Access pattern | Queries | What it tests |
|---|---|---|
| Phrase search over agent text | Q05, Q08, Q11, Q13, Q15 | Tokens and phrases in input and output, with tenant or app filters |
| Filters on dynamic JSON | Q07, Q10, Q12, Q16-Q20 | Filters and groups over paths such as payload.attr.release_ring and payload.provider.stop_reason |
| Ordered trace replay | Q03, Q04 | Fetching one trace in seq_no order and reconstructing the call tree |
| Live dashboard refreshes | Q01, Q02, Q06, Q09, Q14 | Top-N listings, cost and latency rollups, tool distributions, and incident keyword panels |
Engine Configuration
Each engine uses its native representation while preserving the same logical surface. The point is not to force every engine into identical syntax. The point is to compare how each engine handles the same observation model with its own normal storage and indexing tools.
| Engine | Payload | Text search | Physical layout |
|---|---|---|---|
| Doris | VARIANT for payload | Inverted indexes on input and output | DUPLICATE KEY(trace_id, observation_id, seq_no) |
| ClickHouse | Native JSON type | text() skip index over concatenated text | Order key (biz_date, trace_id, seq_no) |
| Elasticsearch | Native JSON document | Full-text analyzed fields | Default sharding |
| OpenSearch | Native JSON document | Full-text analyzed fields | Default sharding |
| DuckDB | JSON column | String functions | Parquet-style columnar |
| PostgreSQL | JSONB column | tsvector / trigram indexes | B-tree on primary key |
Doris maps text predicates to MATCH_ALL and MATCH_PHRASE, and dynamic paths to CAST(payload['attr'][...] AS STRING). ClickHouse uses dot-notation accessors on payload and per-query token, phrase, substring, or regex functions. The per-engine query files in the repository are the source of truth.
Methodology
Each engine ran on an AWS m6i.8xlarge (32 vCPU, 128 GiB, gp3 SSD) on the same raw shards: roughly 100 million loaded observations. The runner times each query three times. The leaderboard reports the first run as cold and the third as hot. The headline metric for each engine is the geometric mean of its per-query slowdowns versus the per-query winner.
One caveat on cold numbers: the runner clears the Linux page cache between cold queries, but it does not reset Elasticsearch's internal field-data and filter caches. Treat Elasticsearch's cold numbers as page-cache-cold, not as true first-touch.
Results
Storage and Load Time
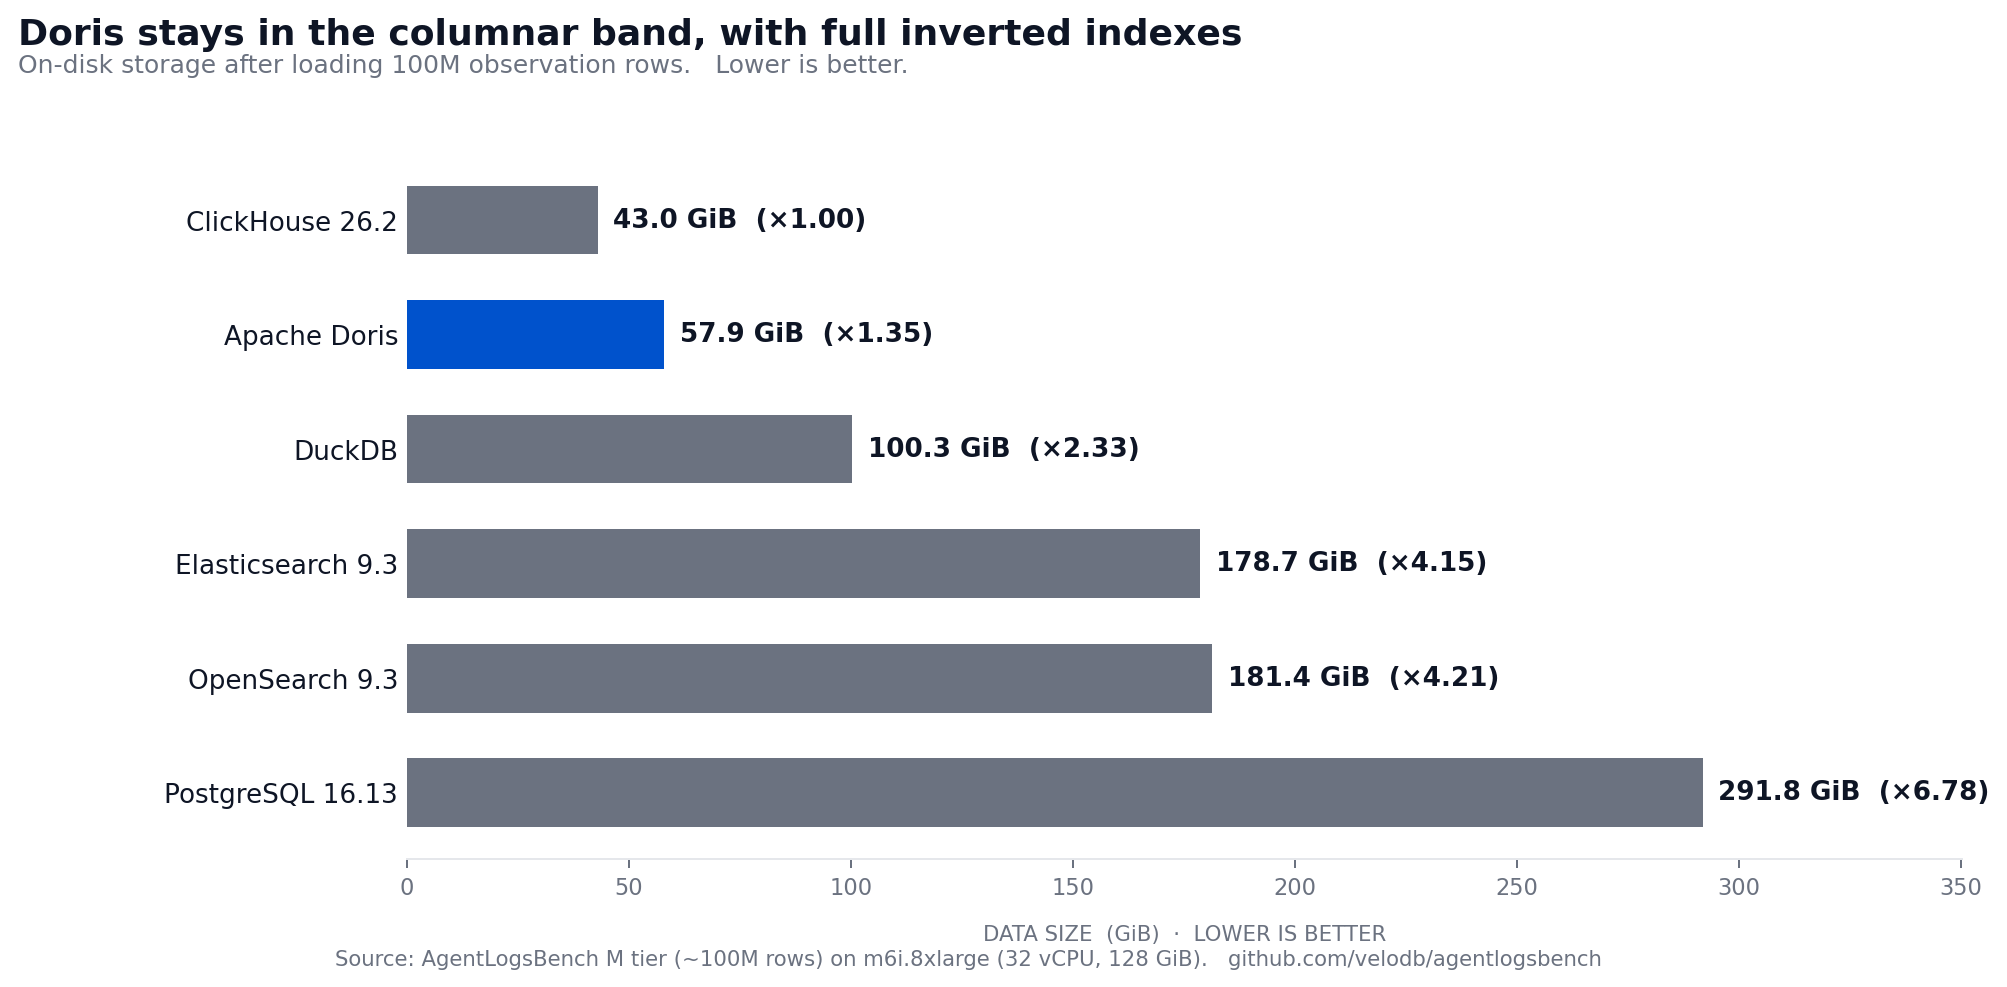
Doris stores the dataset in 57.94 GiB, 1.35x the smallest footprint, while still carrying full inverted indexes on input and output. Elasticsearch and OpenSearch need 3-4x more space to provide comparable text capability.
ClickHouse is the fastest loader at 2,755 s, followed by Doris at 4,396 s. Full numbers are in the leaderboard.
Combined Leaderboard
The benchmark's headline metric is combined relative time across cold and hot, normalized as the geometric mean of per-query slowdowns versus the per-query winner. Lower is better.
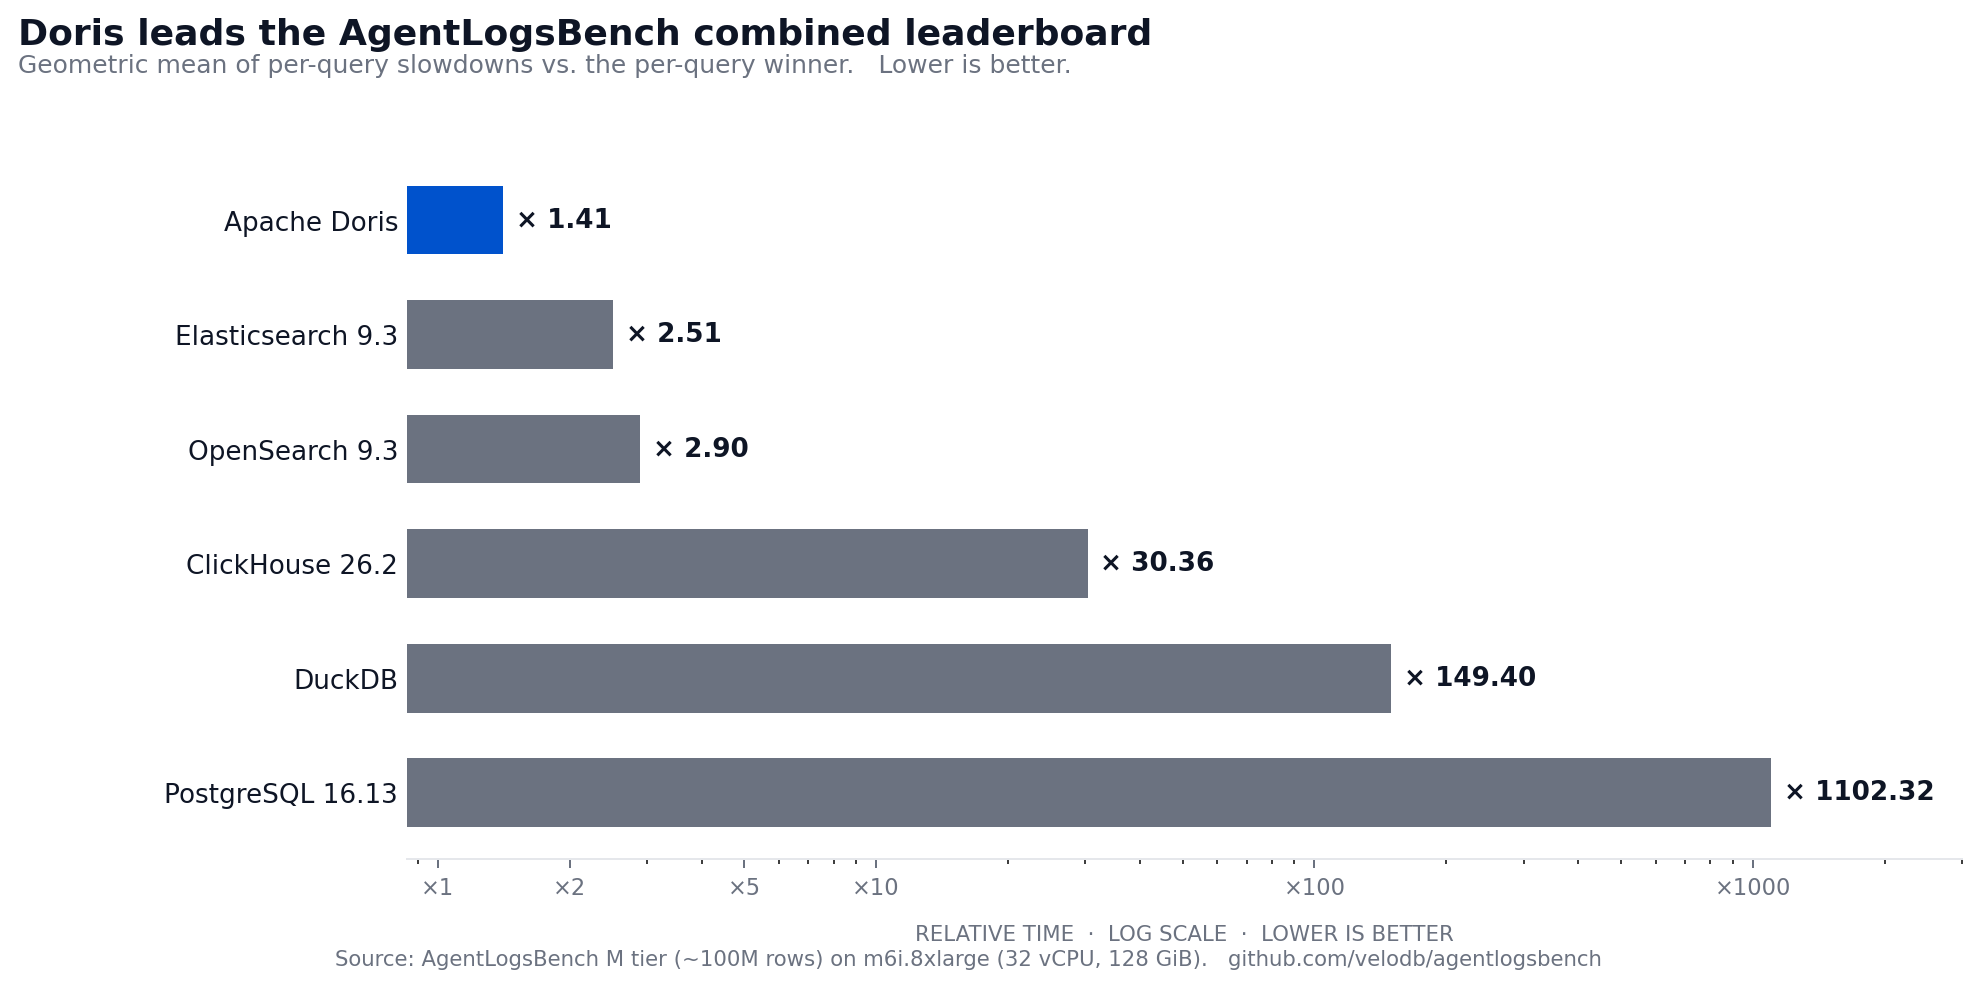
Apache Doris leads the combined leaderboard at x1.41. Unlike the previous benchmark revision, where Elasticsearch led the cold path, Doris now leads both cold and hot, placing it first across all four access patterns.
Hot Query Runtime
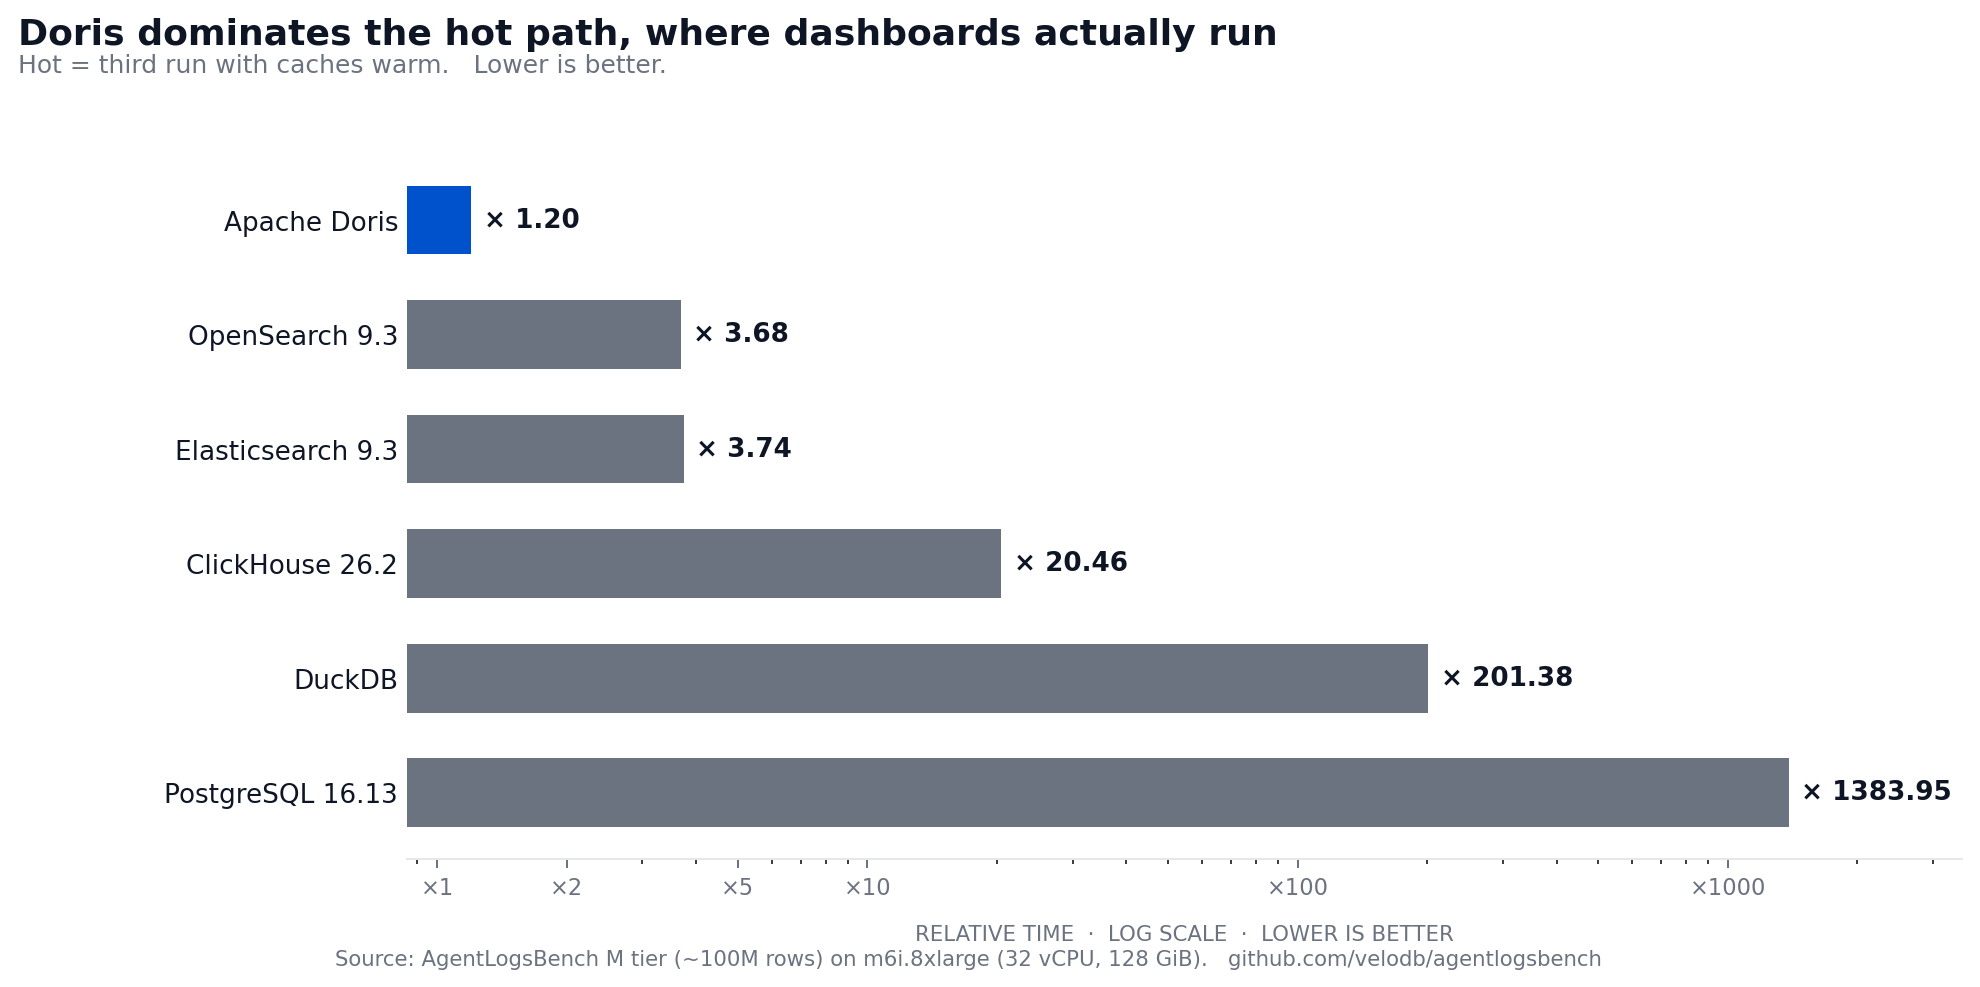
Doris leads the hot path at x1.20, 3x ahead of the search engines and 17x ahead of ClickHouse. Once the working set is touched, the columnar layout, sort-key locality, and inverted indexes converge on a uniformly low per-query cost.
The hot per-query breakdown shows where each engine's design choices land:
Trace replay (Q03, Q04): Doris 0.020 s / 0.036 s vs. ClickHouse 2.289 s / 2.534 s. Doris distributes by HASH(trace_id), which colocates every observation for one trace on a single tablet. DUPLICATE KEY(trace_id, observation_id, seq_no) sorts rows at flush, so the filter lands on contiguous pages and the ORDER BY seq_no collapses into storage order. Replay becomes a sequential read, not a scatter across tablets.
Multi-phrase incident search (Q13, Q15): Doris 0.088 s / 0.081 s vs. Elasticsearch 1.116 s / 1.392 s, ClickHouse 9.3 s / 9.5 s. Doris carries inverted indexes on the input and output columns with a tokenizer tuned for code and path punctuation. Index-driven boolean evaluation pays off once the index is hot.
Dynamic payload filters (Q16, Q17): Doris 0.078 s / 0.030 s vs. Elasticsearch 0.802 s / 0.053 s. Doris's VARIANT type promotes frequently-accessed payload paths to typed subcolumns at compaction time. Once payload.attr.release_ring becomes hot, a predicate reads one column page rather than parsing a JSON document per row. Long-tail keys hash into one of N buckets, so each filter reads 1/N of the sparse column instead of scanning all of it.
Structured text retrieval (Q08): Doris 0.135 s vs. Elasticsearch 0.452 s on a rare-tail token-AND shape with phrase constraint. Doris now wins this query shape both cold and hot, where the previous benchmark revision showed Elasticsearch ahead. The improvement comes from inverted-index intersection strategies that advance on the rare token first.
Cold Query Runtime
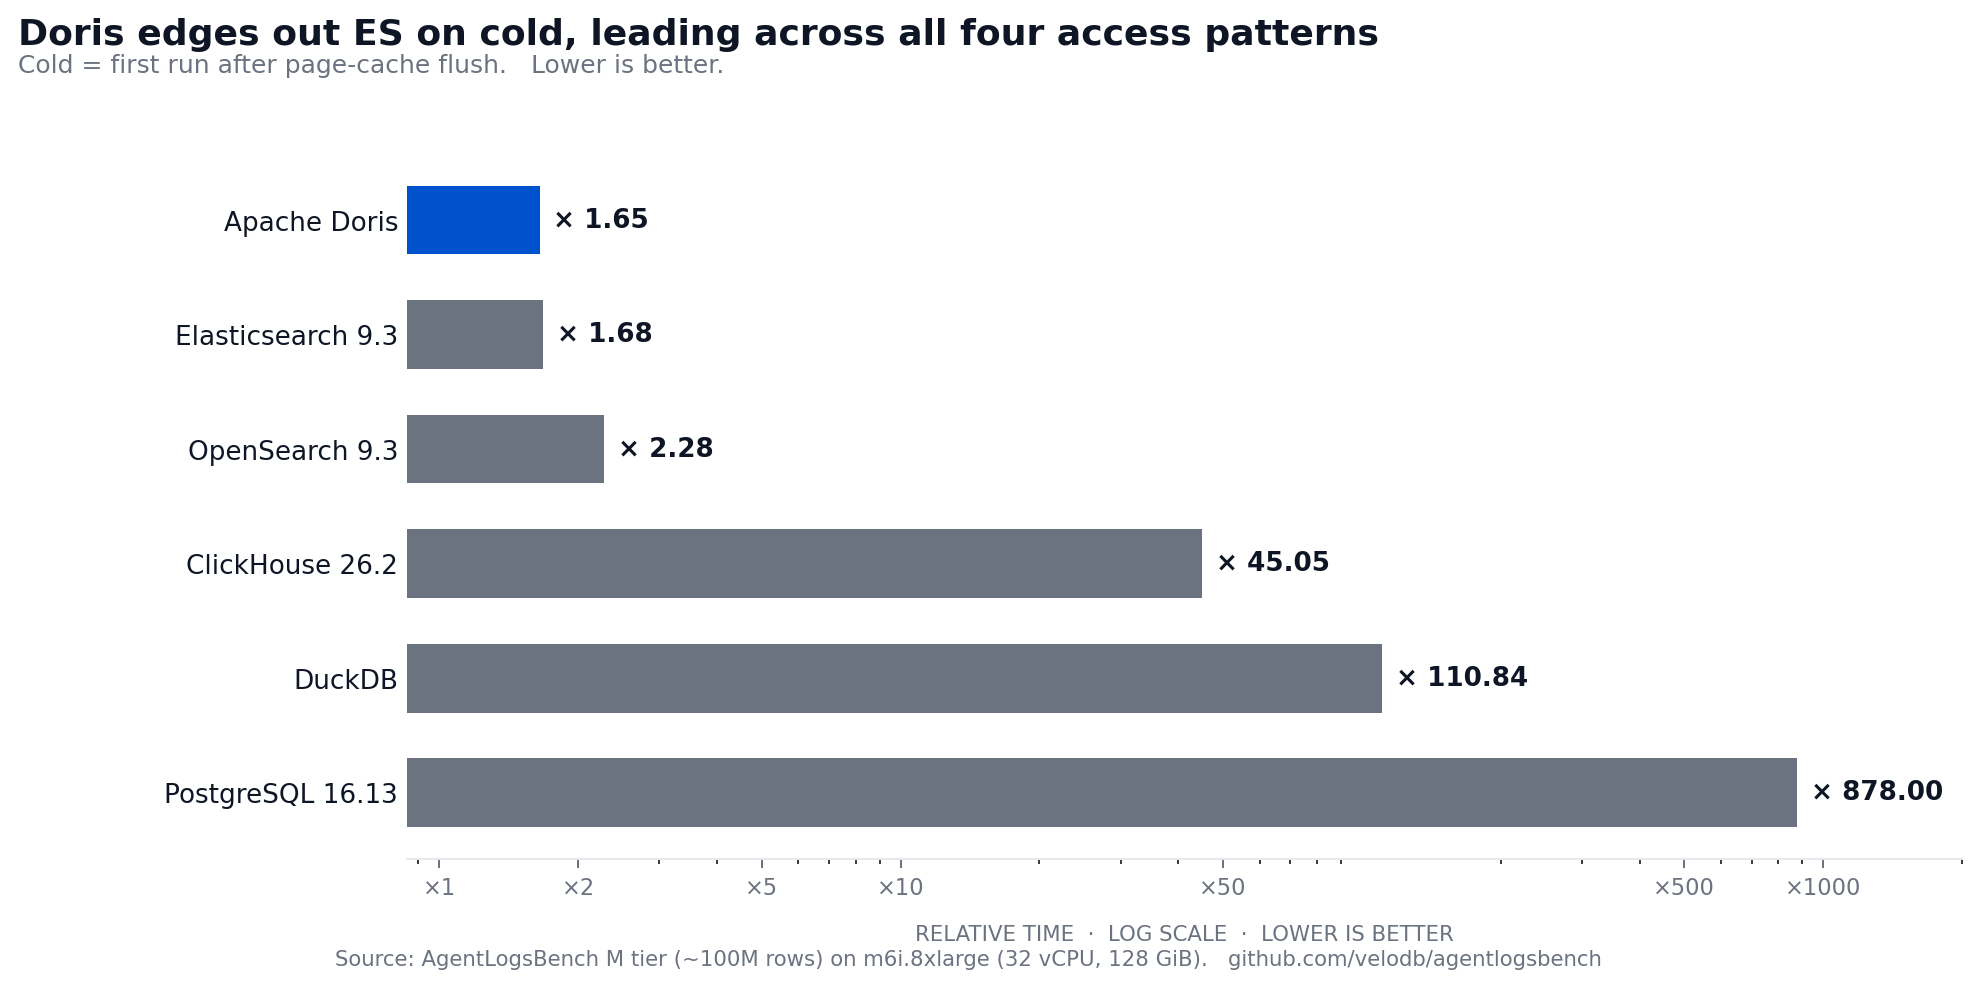
Doris leads cold at x1.65, narrowly ahead of Elasticsearch at x1.68. This is a shift from the previous benchmark revision where Elasticsearch led cold by a wider margin. The cold story splits by query shape:
Phrase search over long text still favors ES on several queries. Elasticsearch finishes Q05 in 0.757 s cold; Doris takes 11.3 s. ES's mature inverted-index implementation gives it an advantage on cold phrase search when the working set has not been touched. But Doris wins the overall cold leaderboard by winning more queries across the other access patterns.
Trace replay and dynamic payload are fast cold. Q03 finishes in 0.088 s cold on Doris vs. 0.043 s on Elasticsearch. Q16 and Q17 (dynamic payload filters) finish in 0.451 s and 0.142 s on Doris, close to ES at 0.969 s and 0.159 s.
Doris wins the cold rare-tail text shape. Q08, where Elasticsearch led in the previous revision, now finishes in 0.372 s on Doris vs. 1.266 s on Elasticsearch cold. This reflects improvements in Doris's inverted-index intersection strategy.
Per-Query Breakdown
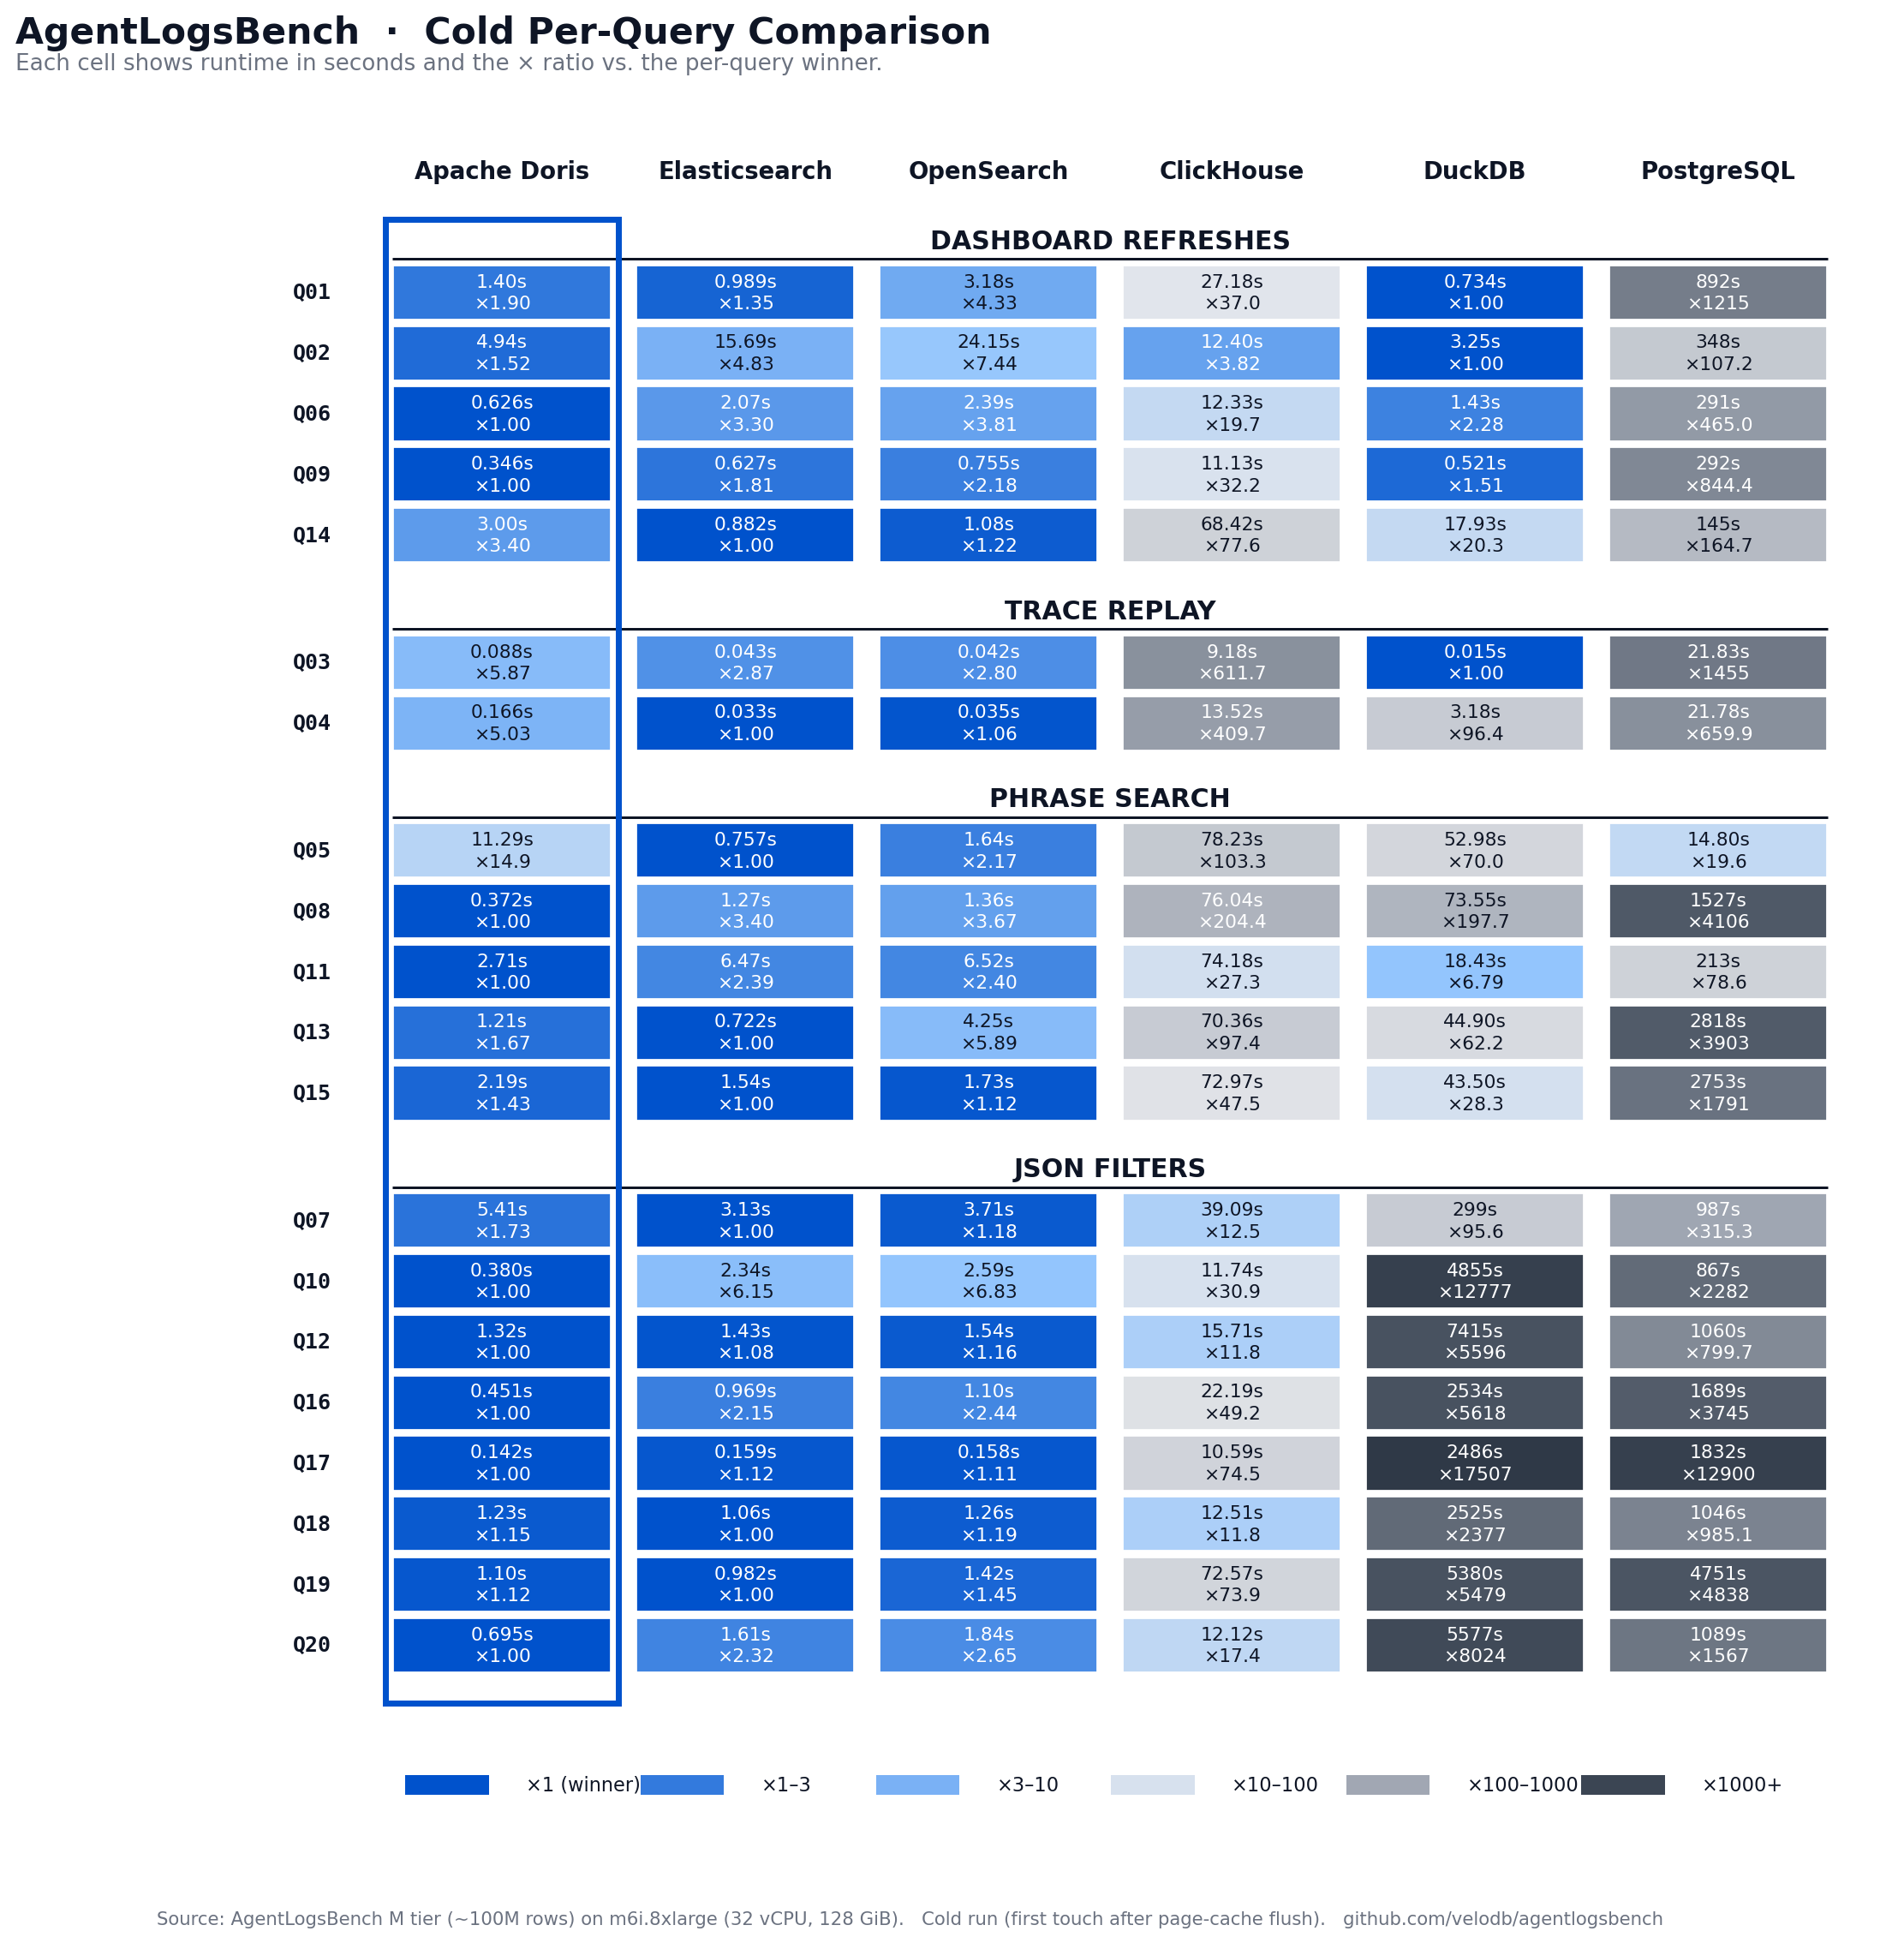
The heatmap shows cold runtime and relative-time ratio per query, grouped by the four access patterns. The Doris column stays light across most queries. Elasticsearch trades light cells on phrase search for darker cells on dashboard and replay queries. ClickHouse stays mid-range across the board. DuckDB and PostgreSQL show dark spikes on Q10 and Q16-Q20, where their long-tail JSON handling collapses.
Interpreting the Results
AgentLogsBench is a workflow benchmark, not a primitive benchmark. Its 20 queries force the same observation table to support all four access patterns simultaneously. The results reveal a structural advantage for engines that can serve phrase search, dynamic JSON filters, trace replay, and dashboard aggregations from one storage layout.
Doris wins the combined leaderboard because it keeps all four access paths inside one columnar SQL engine. Four architectural decisions drove the result we see:
Inverted indexes on text columns make phrase search index-driven. The search() function in Doris 4.1 folds boolean and phrase logic into one Lucene-style expression, so an operator can search for multiple failure signatures across input and output in a single statement.
VARIANT with tiered subcolumn storage makes dynamic JSON filters run at columnar speed. Hot paths promote to typed subcolumns automatically. Long-tail keys hash into buckets so each filter touches only a fraction of the sparse data. The operator never writes a schema migration to query a new attribute.
DUPLICATE KEY with HASH distribution on trace_id makes replay a sequential read. Every observation for one trace lands on one tablet, sorted by seq_no at flush. Q03 finishes in 20 ms hot because the query reads contiguous pages, not scattered blocks.
Partition pruning, bloom filters, zone maps, and version-aware caching make dashboard refreshes survive concurrent ingest. Condition Cache memoizes each filter's per-segment bitmap, so subsequent refreshes skip filter evaluation on segments that have not changed. Query Cache memoizes the pipeline result and returns it without a scan until ingest commits new data.
The tradeoff is operational control; Doris exposes knobs for subcolumn budgets, sparse sharding, compaction, indexes, and cache behavior. Those knobs serve observability workloads well, but you have to set them deliberately.
The right conclusion is not to read a vendor-published benchmark as a neutral truth. The right conclusion is that AgentLogsBench captures the workload shape AI platforms increasingly need to serve, and Doris has a coherent engineering architecture for that shape.
Try It Yourself
Audit and reproduce every result. The benchmark repository, queries, schemas, and data generation scripts are open at velodb/agentlogsbench. The live leaderboard is at https://velodb.github.io/agentlogsbench/.
To run agent observability on Doris without managing the infrastructure yourself, try VeloDB Cloud. It runs Apache Doris as a fully managed service with the same VARIANT, inverted index, and caching capabilities that drive the benchmark results.