Datadog is one of the most widely used observability platforms for monitoring infrastructure, applications, logs, and traces. However, many engineering teams eventually look for Datadog alternatives due to rising costs, scaling challenges, or the need for more flexible telemetry architectures.
In this guide, we compare the 8 best Datadog alternatives in 2026 based on scalability, observability features, cost transparency, and support for modern telemetry workloads.
The platforms covered include:
- VeloDB
- New Relic
- SigNoz
- Dynatrace
- Grafana Cloud
- Elastic Observability
- Splunk
- IBM Instana
Why teams look for Datadog alternatives
Many teams start with Datadog because of its strong APM and monitoring capabilities. However, as systems scale, several limitations become more apparent.
1. Rising and unpredictable costs
One of the most commonly discussed issues with Datadog is cost escalation.
Pricing is often tied to multiple variables:
- number of hosts
- log ingestion
- custom metrics
- trace volume
As infrastructure grows, monitoring costs can increase rapidly.
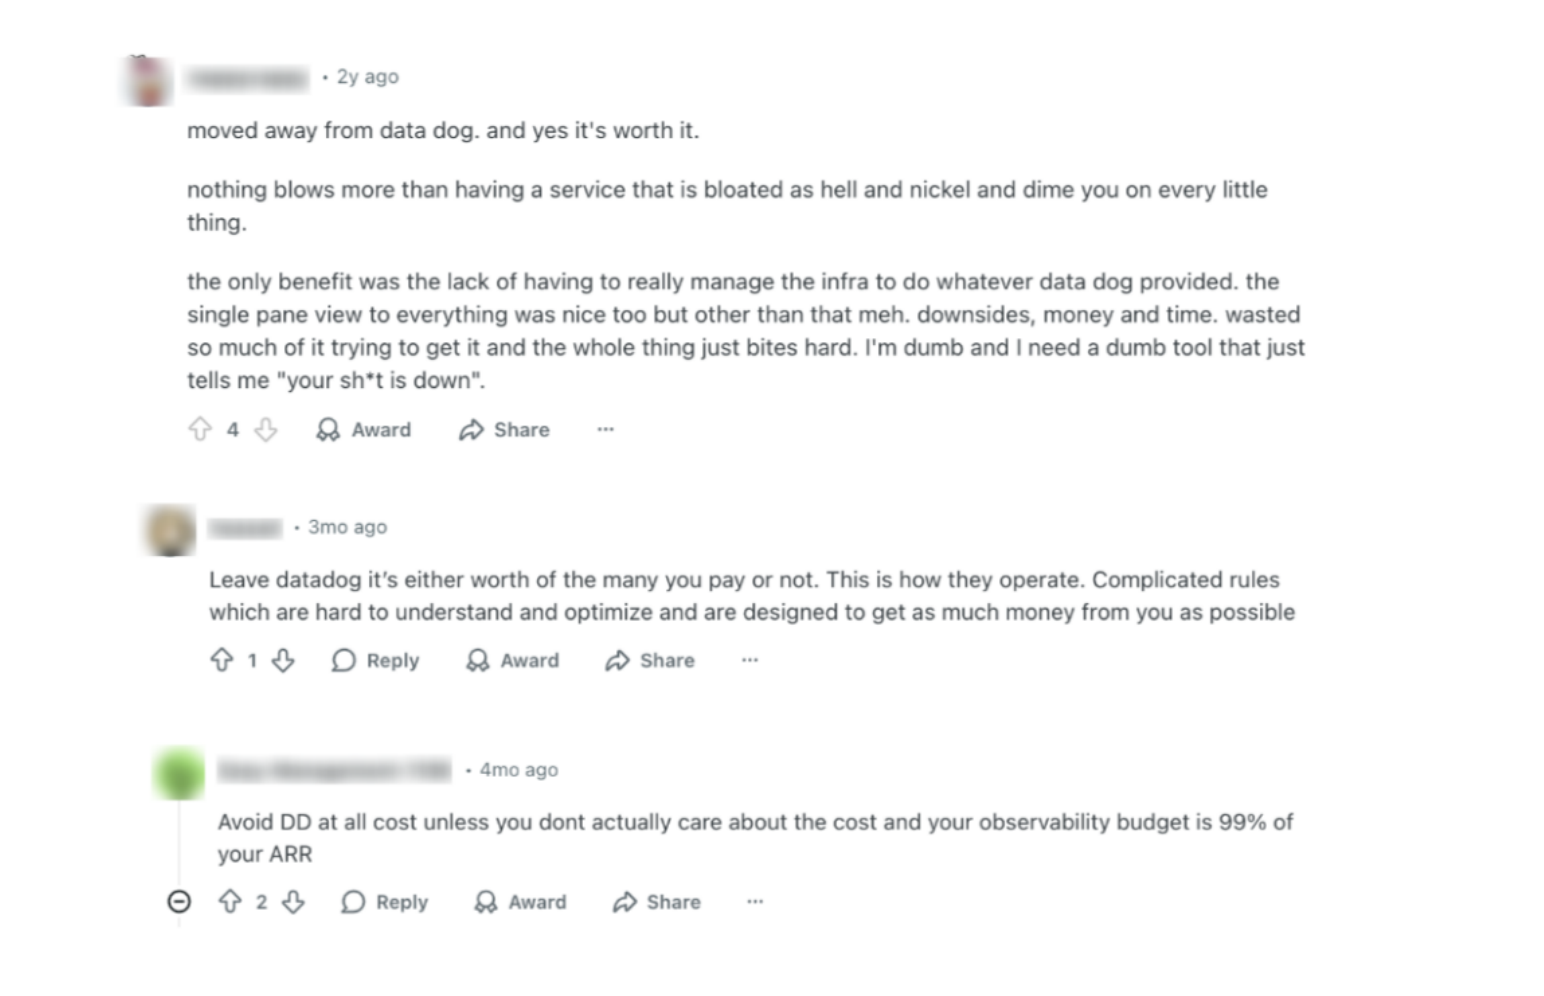
In fact, many engineers on Reddit frequently describe Datadog costs as difficult to predict, especially when dealing with large-scale log ingestion or high-cardinality metrics. This real-world feedback has pushed many teams to evaluate alternative observability platforms with more transparent pricing models.
2. High-cardinality data becomes expensive
Modern observability systems often generate high-cardinality data, including:
- user-level metrics
- container-level telemetry
- AI workload metrics
- request-level tracing
Datadog can handle this data, but costs often scale linearly with ingestion volume.
Teams dealing with large telemetry streams or AI**/ML workloads** often look for platforms designed to handle high-cardinality data more efficiently.
3. Ingestion vs query tradeoffs
Another common limitation is the ingestion-heavy pricing model.
Datadog charges primarily based on the amount of data ingested, which means teams must constantly balance:
- telemetry detail
- cost constraints
- retention periods
Some observability platforms instead focus on query-efficient architectures, allowing teams to ingest more data without dramatically increasing cost.
4. Vendor lock-in and ecosystem dependence
Datadog offers a powerful ecosystem of integrations, but that ecosystem can also create vendor lock-in.
Teams increasingly prefer platforms built around open standards such as OpenTelemetry, which allow telemetry data to be routed to different backends.
Evaluation criteria for Datadog alternatives
When evaluating Datadog alternatives, engineering teams typically look beyond feature parity. The most important considerations often revolve around how well a platform can scale with modern telemetry workloads while remaining cost-efficient and easy to operate.
Below are the key aspects teams usually consider when comparing observability platforms.
1. Telemetry architecture and data handling
Modern observability systems generate massive volumes of telemetry data—from logs and traces to high-cardinality metrics and distributed events.
A strong Datadog alternative should be able to ingest and analyze large amounts of telemetry data without introducing performance bottlenecks. Platforms designed with scalable analytics architectures can process high-volume observability data while still allowing fast queries, flexible retention policies, and deep historical analysis.
This becomes especially important for organizations running microservices, containerized workloads, or AI systems, where telemetry data grows rapidly.
2. Cost efficiency and pricing transparency
Cost is one of the most common reasons teams explore Datadog alternatives.
Many observability platforms charge based on data ingestion, which can make monitoring costs difficult to predict as systems scale. When evaluating alternatives, teams often look for pricing models that are easier to forecast and better aligned with long-term infrastructure growth.
Platforms that offer transparent pricing, flexible storage options, or more efficient telemetry architectures can significantly reduce observability costs over time.
3. End-to-end visibility and debugging experience
An effective observability platform should provide a unified view of the entire system, from frontend applications to backend services and infrastructure.
This typically includes integrated visibility across:
- application performance
- infrastructure metrics
- distributed tracing
- log analysis
Platforms that combine these signals in a single interface make it much easier for engineers to identify performance issues, investigate incidents, and trace root causes across complex distributed systems.
How We Evaluated and Tested These Platforms
To ensure this isn't just another feature list, our engineering team spun up a realistic microservices environment to evaluate these observability tools.
Our Test Environment:
- Workload: A containerized e-commerce application running on Kubernetes (EKS) generating a synthetic workload that produced hundreds of gigabytes of logs, thousands of custom metrics, and large volumes of distributed traces per day. This allowed us to simulate high-cardinality telemetry patterns commonly seen in microservices and cloud-native systems.
- Telemetry Collection: We utilized OpenTelemetry (OTel) collectors wherever possible to standardize telemetry ingestion and ensure a consistent data pipeline across the platforms we tested.
Evaluation Metrics:
- Ingestion Performance & Query Latency: How efficiently can the platform ingest telemetry data and query high-cardinality fields (for example, searching for a specific
user_idacross large log datasets)? - Setup & Instrumentation: Does the platform require proprietary agents or complex setup steps, or does it integrate smoothly with open standards such as OpenTelemetry?
- Cost Predictability: We modeled pricing scenarios based on our simulated telemetry workload to evaluate which platforms offer clearer and more predictable cost structures.
- UI**/**UX & Troubleshooting Speed: How quickly could we trace a simulated application error from the frontend service through multiple microservices to identify the underlying database latency issue?
8 Best Datadog Alternatives in 2026
Below is a quick comparison of the leading Datadog competitors.
| Platform | Category & Deployment | Handles High-Cardinality Data | Key Strength | Best For | Pricing Predictability |
|---|---|---|---|---|---|
| VeloDB | Real-time analytics database | Excellent | High-concurrency telemetry analytics | Large-scale observability pipelines | High (Pay for compute/storage, no ingestion tax) |
| New Relic | SaaS observability platform | Moderate | Full-stack monitoring | DevOps teams | Medium (User seats + Data ingested) |
| SigNoz | Open-source observability | Excellent | OpenTelemetry-native | Startups and open-source users | High (Transparent infrastructure cost) |
| Dynatrace | AI-driven observability | Excellent | Automated root-cause analysis | Enterprise environments | Low (Complex Host Unit pricing) |
| Grafana Cloud | SaaS monitoring platform | Moderate | Dashboards and visualization | Metrics-focused monitoring | Medium (Generous free tier, but scales with usage) |
| Elastic Observability | Elasticsearch-based platform | Excellent | Log analytics | Log-heavy environments | Medium (Depends on storage node tiering) |
| Splunk | Data analytics platform | Excellent | Security monitoring and SIEM | Security + observability | Low (Notoriously expensive at high volumes) |
| IBM Instana | Automated APM platform | Moderate | Automatic service discovery | Microservices monitoring | High (Simple per-host pricing, no trace overages) |
1. VeloDB
If you are building a custom observability stack to completely avoid SaaS lock-in, your best choice is a high-performance database. VeloDB is a real-time analytics database designed for high-concurrency analytical workloads. While it is not a traditional observability tool with built-in dashboards and monitoring agents, it is increasingly used as the analytics engine behind large-scale observability pipelines.
Modern observability systems generate massive volumes of telemetry data, including logs, metrics, and traces. As systems grow—especially in microservices architectures or AI-driven applications—this telemetry data quickly becomes difficult to query and analyze in real time. VeloDB addresses this challenge by providing a high-performance analytical database optimized for fast queries on large telemetry datasets.
Instead of focusing on visualization or monitoring interfaces, VeloDB focuses on the data layer of observability, enabling teams to ingest large volumes of telemetry data and analyze it using SQL with sub-second latency.
【Our Testing Experience】
Unlike Datadog's out-of-the-box UI, VeloDB required us to connect a visualization layer such as Grafana to explore telemetry data. However, the tradeoff was worthwhile for data-heavy workloads. In our tests, SQL queries aggregating high-cardinality fields like session_id across tens of millions of log records still returned results quickly. Compared with many SaaS observability tools that rely on sampling or downsampling, VeloDB made it easier to analyze the full dataset directly with SQL. This approach works particularly well for large-scale observability pipelines where query flexibility and performance are critical.
【Key features】
- Sub-second analytics on large telemetry datasets
- High-concurrency query execution for observability workloads
- Real-time ingestion of logs and metrics
- SQL-based analytics for flexible observability queries
This architecture makes VeloDB particularly suitable for observability systems dealing with high-cardinality data, such as user-level metrics, container telemetry, or large distributed systems.
【Pros】
- Handles large-scale telemetry datasets efficiently
- Performs well with high-cardinality observability data
- Supports high-concurrency analytical queries
【Cons】
- Requires additional tools for dashboards and monitoring interfaces(e.g., seamless integration with Grafana or Superset for visualization)
- Setup can be more complex than SaaS observability platforms
【Pricing】
Pricing varies depending on deployment architecture and infrastructure requirements. Organizations typically deploy VeloDB as part of their observability data platform or analytics stack.
2. New Relic
New Relic is one of the most established observability platforms on the market and a common alternative for teams evaluating options beyond Datadog. The platform provides a unified environment for monitoring applications, infrastructure, and user experiences across modern cloud environments.
Originally known for its application performance monitoring (APM) capabilities, New Relic has evolved into a full observability platform that combines logs, metrics, traces, and real user monitoring into a single interface. This unified approach allows engineering teams to track system performance, investigate incidents, and visualize operational data without switching between multiple tools.
New Relic is widely used by DevOps and platform engineering teams that need end-to-end visibility across distributed systems, especially in environments built around microservices and cloud-native infrastructure.
【Our Testing Experience】
The auto-instrumentation was excellent. Within minutes of deploying the agent, our Kubernetes cluster map was populated. We loved the "Errors Inbox" feature, which automatically grouped our injected microservice failures. The UI feels slightly faster than Datadog's, but switching between legacy UI components and the new interface can sometimes be jarring.
【Key features】
- Full-stack observability covering logs, metrics, traces, and APM
- Real user monitoring (RUM) and frontend performance tracking
- Distributed tracing for microservices architectures
- Custom dashboards and query tools for telemetry analysis
- Large ecosystem of integrations with cloud services and developer tools
【Pros】
- Integrated monitoring across multiple telemetry signals
- Mature platform with extensive integrations
- Developer-friendly dashboards and analytics tools
【Cons】
- Pricing can become complex at scale
- Data ingestion costs may increase rapidly in large environments
【Pricing】
New Relic offers a free tier with limited usage. Paid plans are typically based on telemetry data ingestion and advanced feature usage. Unlike Datadog's complex SKU-based pricing, New Relic uses a simplified model based on data ingested and user seats, which many teams find easier to predict.
3. SigNoz
SigNoz is an open-source observability platform that has gained significant traction as a modern alternative to Datadog. Built around the OpenTelemetry ecosystem, SigNoz provides full-stack observability capabilities while allowing organizations to maintain greater control over their telemetry data and infrastructure.
Unlike many proprietary monitoring tools, SigNoz is designed with an open architecture, enabling teams to collect telemetry using OpenTelemetry and store it in a backend optimized for observability workloads. This makes it particularly attractive for organizations that want to avoid vendor lock-in or prefer self-hosted observability solutions.
SigNoz supports monitoring across logs, metrics, and traces, and provides a unified interface for analyzing telemetry data. Its growing popularity among startups and engineering teams reflects the broader shift toward open standards in observability infrastructure.
【Our Testing Experience】
SigNoz felt the most like a "Datadog drop-in replacement." Because it natively uses OpenTelemetry, routing our test data to it was effortless. Its underlying ClickHouse database made metric aggregation incredibly fast. However, we noted that self-hosting SigNoz at a very large scale requires strong internal knowledge of ClickHouse management.
【Key features】
- Native OpenTelemetry support for telemetry collection
- Unified view of logs, metrics, and traces
- Distributed tracing and service dependency visualization
- Built-in dashboards for monitoring infrastructure and applications
- Flexible deployment options including self-hosted and managed cloud
【Pros】
- Fully open-source observability platform
- Native integration with the OpenTelemetry ecosystem
- Transparent and predictable cost structure
【Cons】
- Smaller ecosystem compared to established observability vendors
- Self-hosted deployments require infrastructure management
【Pricing】
SigNoz offers an open-source core that can be self-hosted at no cost. Managed cloud plans are also available for teams that prefer a hosted observability platform.
4. Dynatrace
Dynatrace is a well-known enterprise observability platform designed to provide automated monitoring and deep operational insights across complex systems. Many organizations consider Dynatrace when looking for alternatives to Datadog because of its strong automation capabilities and its focus on AI-driven observability.
The platform is built to monitor modern distributed environments, including microservices architectures, Kubernetes clusters, and large cloud infrastructures. Dynatrace automatically discovers services, maps dependencies between system components, and analyzes telemetry data in real time. This automated approach helps engineering teams quickly identify performance issues and understand how different parts of their systems interact.
A key differentiator of Dynatrace is its AI engine, which analyzes observability data to detect anomalies and identify potential root causes of incidents. Instead of requiring engineers to manually correlate logs, metrics, and traces, the platform attempts to surface actionable insights automatically.
【Our Testing Experience】
Dynatrace's OneAgent is practically magic—deploy it, and it discovers dependencies without manual tagging. During our test, we intentionally broke a database connection. Dynatrace's Davis AI didn't just send an alert; it generated a "Problem Card" pointing exactly to the failing line of code. The downside? The platform is incredibly dense and overwhelming for a small DevOps team.
【Key features】
- AI-powered anomaly detection and root cause analysis
- Automatic service discovery and dependency mapping
- Unified monitoring across infrastructure, applications, and user experience
- Distributed tracing for microservices and cloud-native systems
- Real-time performance monitoring and alerting
【Pros】
- Strong automation for monitoring complex systems
- Advanced AI-driven diagnostics and anomaly detection
- Mature enterprise-grade observability platform
【Cons】
- Enterprise pricing can be expensive for smaller teams
- Platform complexity may require time to learn and configure
【Pricing】
Dynatrace typically follows an enterprise pricing model based on monitored infrastructure, data volume, and feature usage.
5. Grafana Cloud
Grafana Cloud is a widely used observability platform built around the Grafana ecosystem. It provides hosted monitoring services while maintaining compatibility with the popular open-source Grafana stack. Many teams exploring alternatives to Datadog choose Grafana Cloud because of its flexible architecture and strong visualization capabilities.
The platform focuses heavily on metrics monitoring, dashboards, and telemetry visualization. Engineers can create highly customizable dashboards that combine data from multiple sources, making it easier to analyze system behavior and investigate performance issues.
Grafana Cloud integrates with several open-source observability technologies, including Prometheus for metrics, Loki for logs, and Tempo for distributed tracing. This modular architecture allows teams to build a full observability stack while maintaining flexibility over how telemetry data is collected and stored.
Because of its open-source foundation and large community, Grafana Cloud has become a popular choice for organizations that want powerful monitoring dashboards without committing to a fully proprietary observability platform.
【Our Testing Experience】
If you want beautiful, highly customizable dashboards, nothing beats Grafana. Querying logs via Loki (LogQL) took a bit of a learning curve compared to Datadog's simple search, but it's incredibly powerful. Connecting metrics (Prometheus), logs (Loki), and traces (Tempo) manually requires some configuration, but the unified view is stunning once set up.
【Key features】
- Advanced dashboards and data visualization tools
- Metrics monitoring powered by Prometheus
- Log aggregation and search with Loki
- Distributed tracing with Tempo
- Integrations with numerous cloud services and data sources
【Pros】
- Powerful and highly customizable dashboards
- Strong open-source ecosystem and community support
- Flexible integrations with multiple observability tools
【Cons】
- Full observability often requires multiple integrated components
- Initial configuration can be complex for new users
【Pricing】
Grafana Cloud offers a free tier with limited usage. Paid plans follow a usage-based pricing model depending on telemetry volume and platform features.
6. Elastic Observability
Elastic Observability is part of the Elastic Stack and is built on top of Elasticsearch, a distributed search and analytics engine widely used for large-scale data indexing and querying. Many teams consider Elastic Observability as an alternative to Datadog because of its powerful log analytics capabilities and flexible data exploration features.
The platform allows engineers to collect and analyze telemetry data—including logs, metrics, and traces—within a unified environment. Because Elasticsearch is designed for fast search across massive datasets, Elastic Observability is particularly effective in environments where log data volume is extremely high, such as large distributed systems or infrastructure-heavy applications.
Elastic’s observability tools also integrate with the broader Elastic ecosystem, which includes solutions for search, security analytics, and machine learning. This makes it a flexible option for organizations that want to combine observability with broader data analytics capabilities.
【Our Testing Experience】
Elastic Observability performed particularly well for log analytics during testing. Once log data was indexed in Elasticsearch, searching across large log datasets remained fast and flexible thanks to its distributed search architecture. We especially appreciated the ability to perform full-text search and complex queries across large volumes of log data. However, when using Kibana for APM and distributed tracing workflows, the experience felt slightly heavier and less streamlined than dedicated APM platforms like Datadog or New Relic.
【Key features】
- Distributed log analytics powered by Elasticsearch
- Unified monitoring for logs, metrics, and traces
- Flexible query capabilities for telemetry data exploration
- Machine learning features for anomaly detection
- Integration with the broader Elastic Stack ecosystem
【Pros】
- Strong capabilities for log search and analytics
- Highly flexible data querying and exploration
- Large ecosystem and open integrations
【Cons】
- Requires significant infrastructure for large deployments
- Performance tuning may be necessary at scale
【Pricing】
Elastic Observability typically follows a usage-based pricing model depending on infrastructure size, data ingestion, and feature usage.
7. Splunk
Splunk (now a Cisco company) is one of the most established platforms in the monitoring and analytics space, widely used for security monitoring, log analysis, and enterprise data analytics. While it originally focused on log management and SIEM (Security Information and Event Management), Splunk has expanded its capabilities to include full observability features.
Many organizations evaluate Splunk as a Datadog alternative because of its powerful data analytics engine and its ability to process large volumes of operational data. Splunk allows teams to ingest telemetry from multiple sources—including logs, metrics, and traces—and analyze that data using its flexible search and analytics tools.
Splunk is especially common in large enterprises that require both observability and security monitoring capabilities. Its ecosystem includes integrations with numerous enterprise systems, making it suitable for organizations with complex infrastructure and strict compliance requirements.
【Our Testing Experience】
Writing SPL (Search Processing Language) queries gave us significant flexibility when analyzing observability data. Splunk handled high volumes of log ingestion reliably during testing and remained stable when running complex searches. However, the interface and workflow often feel more tailored to data analysts and security teams than to developers looking for quick insights into distributed tracing or application performance.
【Key features】
- Large-scale log analytics and telemetry data ingestion
- Advanced search and query capabilities for operational data
- Integrated observability features for metrics and traces
- SIEM and security monitoring capabilities
- Extensive integration ecosystem for enterprise environments
【Pros】
- Extremely powerful analytics and search engine
- Strong capabilities for security and observability combined
- Mature platform with extensive enterprise adoption
【Cons】
- Can become very expensive as data volume grows
- Deployment and management may be complex for smaller teams
【Pricing】
Splunk typically uses an enterprise pricing model based on data ingestion volume, infrastructure size, and feature usage.
8. IBM Instana
IBM Instana is an application performance monitoring (APM) platform designed to provide automated observability for modern cloud-native systems. It focuses on monitoring applications and infrastructure in environments built around microservices, containers, and dynamic cloud architectures.
Instana is often evaluated as a Datadog alternative because of its automation capabilities and its emphasis on real-time application monitoring. The platform automatically discovers services, traces dependencies between components, and collects telemetry data without requiring extensive manual configuration.
By continuously monitoring application performance and infrastructure health, Instana helps engineering teams quickly detect performance issues and investigate incidents across distributed systems. Its automated service mapping and tracing capabilities make it particularly useful in environments with rapidly changing service architectures.
【Our Testing Experience】
Two things stood out during our test. First, Instana collects high-frequency metrics and traces, which helped us detect short-lived CPU spikes and latency issues more easily. Second, once the agent was installed, services and dependencies were automatically discovered with minimal configuration. This made it much easier to visualize application performance across our microservices environment compared with tools that require more manual setup.
【Key features】
- Automatic service discovery and dependency mapping
- Real-time monitoring of applications and infrastructure
- Distributed tracing for microservices environments
- Automatic instrumentation for supported technologies
- Performance analytics for application and service monitoring
【Pros】
- Strong automation for application performance monitoring
- Automatic service mapping reduces manual configuration
- Effective monitoring for microservices-based systems
【Cons】
- Less flexible compared to some open observability platforms
- Enterprise-focused pricing model
【Pricing】
Instana offers a simple, single-price-per-host model with un-sampled, full-fidelity tracing included. This is a major advantage for teams tired of Datadog's overage fees for high trace volumes.
Frequently asked questions
What is the best Datadog alternative?
The best Datadog alternative depends on your team’s infrastructure and observability needs. Platforms such as SigNoz and Grafana Cloud are popular among teams that prefer open-source or flexible observability stacks, while Dynatrace and Splunk are often used in enterprise environments. Some platforms, like VeloDB, focus on the data and analytics layer of observability, enabling fast analysis of large telemetry datasets.
Why are companies switching from Datadog?
Many teams start exploring Datadog alternatives because of pricing predictability and scaling challenges. Datadog’s usage-based pricing model can become expensive as telemetry ingestion grows. Organizations handling large volumes of logs, metrics, and traces often look for platforms that offer more efficient data processing or clearer pricing structures.
Are there open-source alternatives to Datadog?
Yes, several open-source observability platforms can serve as alternatives to Datadog. SigNoz is a popular option built around OpenTelemetry, while the Grafana ecosystem (including Prometheus and Loki) is widely used for metrics and log monitoring. These tools allow organizations to build observability stacks with greater control over infrastructure and data.
What should you look for in a Datadog alternative?
When evaluating Datadog alternatives, teams usually consider three factors: scalability, pricing transparency, and observability capabilities. The platform should be able to handle large volumes of telemetry data while providing clear system visibility through logs, metrics, and traces. Integration with modern cloud-native environments is also an important consideration.
Conclusion
Datadog remains a powerful observability platform, but it is no longer the only option for monitoring modern infrastructure. As telemetry data volumes grow and systems become more complex, many organizations are exploring alternatives that offer better cost predictability, flexible architectures, and stronger support for large-scale observability workloads.
Platforms such as VeloDB, SigNoz, Dynatrace, and Grafana Cloud represent different approaches to observability—from open-source ecosystems to enterprise automation and high-performance telemetry analytics. Choosing the right solution ultimately depends on your infrastructure scale, operational requirements, and observability strategy.