Modern systems don’t fail loudly—they fail gradually, silently, and across layers. As architectures become more distributed and data-driven, observability tools have moved from “nice to have” to a core part of operating reliable software.
In this guide, we review 8 observability tools worth knowing in 2026, explain what each one is best at, and—more importantly—where each one fits (or doesn’t) in a modern observability stack.
What Are Observability Tools?
Observability tools help teams understand how and why systems behave the way they do by analyzing the signals those systems continuously emit. Unlike traditional monitoring—which focuses on checking predefined conditions such as whether a service is “up” or a threshold is crossed—observability is about explaining system behavior under real-world, often unpredictable conditions.
In modern distributed systems, failures rarely have a single cause. Latency increases, partial outages, or data inconsistencies usually emerge from interactions across services, infrastructure, and data pipelines. Observability tools are designed to surface these interactions, allowing teams to move from symptoms to root causes.
At their core, observability tools help answer questions such as:
- Why is latency increasing for a specific user group but not others?
- Where in the system is data getting delayed, dropped, or duplicated?
- What changed shortly before an incident or performance regression occurred?
- How does a local failure propagate across services and regions?
Rather than assuming you already know what to monitor, observability tools are built to support exploration and investigation, especially when the failure mode is not known in advance.
Core Components of Observability Tools
Most observability tools are built around three foundational signal types. Each signal provides a different perspective on system behavior, and none of them is sufficient on its own.
1. Metrics
Metrics are numerical measurements collected over time, such as CPU utilization, request latency, throughput, or error rates. They are highly efficient to store and query, making them ideal for trend analysis, dashboards, and alerting.
However, metrics are inherently aggregated. While they are excellent at telling you that something is wrong, they often lack the context needed to explain why it is happening.
2. Logs
Logs are discrete records of events, state changes, or system output. They provide rich, high-fidelity detail and are often the primary source for debugging unexpected behavior.
The challenge with logs is scale. As systems grow, logs become high-volume and high-cardinality, making them expensive to store and difficult to query without strong indexing, retention strategies, and analytical capabilities.
3. Traces
Traces represent end-to-end request paths across distributed systems, showing how a single request flows through multiple services and components. Traces are particularly valuable for understanding latency, dependencies, and failure propagation.
In practice, traces are often sampled to control cost, which means they may not capture every failure. This makes traces powerful but incomplete when used in isolation.
4. Profiling
Profiling focuses on how system resources are consumed inside running code, such as CPU time, memory allocation, or lock contention. Unlike metrics and traces, profiling uses low-overhead sampling to build a statistical view of where time and resources are actually spent.
This makes profiling especially useful for performance optimization. It helps identify hotspots in code paths, memory pressure, and inefficiencies that are hard to see from request-level data alone. When combined with metrics, logs, and traces, profiling adds code-level context to observability investigations.
Effective observability tools correlate metrics, logs, traces, and profiling so teams can investigate issues end to end—from system behavior, to individual requests, to code-level performance bottlenecks.
Observability Tools vs Observability Platforms
| Dimension | Observability Tools | Observability Platforms |
|---|---|---|
| Scope | Specialized (logs/metrics/traces/alerting) | End-to-end (collect → store → analyze → alert) |
| Signal coverage | Often partial | Usually multi-signal |
| Correlation | Depends on integrations | Built-in correlation |
| Flexibility | High (mix-and-match) | Lower (more opinionated) |
| Setup | Faster to adopt | More complex upfront |
| Best for | Modular stacks, specific bottlenecks | Unified workflows, standardization |
The terms observability tools and observability platforms are often used interchangeably, but they describe different levels of scope.
- Observability tools typically specialize in one or two areas, such as log analytics, metrics collection, tracing, visualization, or alerting. They excel at specific tasks but rely on integration with other systems to provide a complete observability workflow.
- Observability platforms aim to provide an integrated, end-to-end experience. They usually cover data collection, storage, querying, visualization, alerting, and incident response within a single system or tightly coupled stack.
In practice, most real-world observability setups are composed systems rather than monolithic platforms. Teams often combine:
- A platform for ingestion, alerting, and operational workflows
- Specialized tools or databases for deep analysis, high-cardinality data, or custom investigations
This modular approach reflects the reality that no single product excels equally at collection, storage, querying, and analysis at all scales.
Why Observability Tools Matter in 2026
In 2026, observability is no longer just about uptime. Most systems are technically “up” even when users are having a terrible experience. The real challenge is that modern failures are increasingly partial and distributed: latency might rise only in one region, error rates might spike only for a specific customer tier, or a pipeline might silently drop a small percentage of events without triggering obvious alarms.
This is happening because production systems have changed. Architectures are more distributed (microservices, Kubernetes, multi-cloud, edge), workloads are more data-intensive (streaming, CDC, real-time analytics), and software changes more frequently than ever through rapid deploys and feature flags. In that environment, failures rarely show up as a single broken metric. They show up as patterns across services, signals, and time.
That’s why observability tools matter. They help you see system-level behavior instead of isolated symptoms, and they make investigation practical when you don’t already know what you’re looking for. More importantly, good observability reduces MTTR not by giving you more dashboards, but by letting you connect cause and effect quickly—across metrics, logs, and traces—so you can fix issues with confidence rather than guesswork. Over time, this also enables better operational decision-making, because teams can quantify reliability, performance, and cost trade-offs using real production evidence.
What to Look for When Choosing Observability Tools
When evaluating observability tools, focus less on feature checklists and more on architectural fit. The best tool is not the one with the longest list of features—it’s the one that matches your system’s scale, signal volume, and operational maturity.
Below are the most important factors to evaluate.
1. Signal Coverage and Correlation
Most tools claim they support metrics, logs, and traces. The real question is whether they can correlate them in a way that helps investigations.
Look for workflows such as:
- Jumping from a latency spike to the traces causing it
- Jumping from a trace span to the exact logs for that request
- Correlating errors with deploys, config changes, or feature flags
If correlation is weak, you’ll end up with three separate tools and no unified story.
2. Query and Analysis Flexibility
Observability is fundamentally investigative. When incidents happen, your questions rarely match predefined dashboards.
A strong tool should support:
- Ad-hoc exploration without rigid dashboards
- High-cardinality slicing (service, customer, device ID, region, tag)
- Fast filtering and grouping across large datasets
- The ability to ask “what changed?” without rewriting the whole pipeline
This is often where tools separate into two categories: workflow-first platforms vs analysis-first systems.
3. Scalability and Performance
Observability data grows faster than most teams expect.
Evaluate how the tool behaves under:
- High ingestion rates (logs and traces are the usual cost driver)
- High cardinality (labels, tags, user IDs, device IDs)
- High query concurrency (especially for customer-facing or multi-team usage)
A tool that works perfectly in a staging environment can collapse under production scale if it is not designed for high-cardinality and heavy querying.
4. Deployment and Openness
SaaS platforms are often easier to adopt, but self-hosted and hybrid setups still matter for:
- Data residency requirements
- Security and compliance constraints
- Cost control at scale
- Vendor lock-in concerns
OpenTelemetry support is especially important in 2026. It reduces instrumentation friction and makes it easier to switch backends or adopt a multi-tool strategy without rewriting your entire telemetry pipeline.
5. Cost and Operational Efficiency
Observability tools can become one of the most expensive parts of a modern infrastructure stack.
Cost evaluation should include:
- Pricing model (by host, by ingestion, by query, by seats)
- Retention and tiering options
- Sampling and aggregation controls
- The operational cost of running the tool (especially for self-hosted systems)
In practice, the “best” observability tool is often the one that gives you enough insight without forcing you to pay observability tax at scale.
8 Observability Tools in 2026
Below is a practical review of eight widely used observability tools, with an emphasis on what each one is actually good at.
| Tool | Open Source / OpenTelemetry | Search Capability | Co-Analyze (Logs, Metrics, Traces) | Deployment Options | Cost & Efficiency | Best Use Case |
|---|---|---|---|---|---|---|
| Datadog | Proprietary with strong OTel support | Strong log + APM search | Excellent built-in correlation | SaaS | Powerful but expensive at scale | Fastest path to full-stack SaaS observability |
| Dynatrace | Proprietary with OTel + native agent | Strong platform-wide querying | AI-driven cross-signal analysis | SaaS + enterprise options | Consumption-based pricing | Large enterprises needing automation and governance |
| New Relic | Proprietary with strong OTel support | Unified querying via NRQL | Strong single-model correlation | SaaS | Usage-based pricing | Dev teams wanting unified self-serve workflows |
| Splunk | Proprietary with OTel Collector | Best-in-class log search (SPL) | Strong but module-dependent | SaaS + self-managed | Premium pricing model | Log-heavy organizations and Splunk ecosystems |
| Elastic Observability | Open-source roots with OTel support | Excellent full-text search | Strong within Elastic Stack | SaaS + self-managed | Flexible with storage tiering | Search-first observability with deployment control |
| OpenSearch | Open source (Apache 2.0) with OTel support | Strong search + aggregations | Moderate, more DIY integration | Self-managed + managed | Cost-efficient when self-hosted | Open-source search-driven observability |
| Grafana Cloud | Open-source stack with native OTel ingestion | Good for logs and traces | Excellent dashboards and linking | SaaS + self-managed | Flexible pricing tiers | Cloud-native teams using Prometheus/Loki |
| VeloDB | Built on Apache Doris with OTel integration | High-performance SQL + inverted index | Strong SQL-based cross-signal analysis | Self-managed + cloud | Efficient for large-scale retention | Large-scale observability with cost sensitivity |
1. Datadog
 Datadog is one of the most widely adopted SaaS observability platforms, and it’s usually the fastest way to go from “we’re blind in production” to “we can debug reliably.” It provides full-stack coverage across metrics, logs, traces, RUM, and synthetics, with strong correlation workflows that let you jump from a dashboard spike to a trace, and from a trace to the exact logs causing it. Datadog also stands out for its polished alerting, anomaly detection, and incident workflows—especially in Kubernetes and multi-cloud environments where integration depth matters.
【Pros】
- Excellent end-to-end user experience and UI
- Strong correlation across signals with minimal setup
- Massive integration ecosystem and mature alerting
【Cons】
- Costs can grow quickly with high-volume logs and traces
- Less flexible for deep custom analysis beyond the built-in workflows
【Cost & Efficiency】
Usage-based pricing scales with hosts, ingestion, and custom metrics. It’s efficient at small-to-mid scale, but at large scale you’ll need aggressive retention, sampling, and cost governance.
2. Dynatrace
 Dynatrace is an enterprise observability platform optimized for automation. Its strongest differentiator is how much it can do without manual configuration: automatic service discovery, dependency mapping, anomaly detection, and AI-assisted incident correlation and root-cause hypotheses are core to the product. Dynatrace is often adopted in complex enterprise environments where teams want fewer “observability engineers” and more automated detection and diagnosis. It is especially strong in large, hybrid environments where topology and dependency understanding are hard to maintain manually.
【Pros】
- Excellent automation and minimal manual setup
- Strong root-cause analysis and topology mapping
- Mature enterprise governance features
【Cons】
- Premium pricing and potential vendor lock-in
- Less flexible for custom pipelines and deep ad-hoc analytics
【Cost & Efficiency】
Dynatrace is expensive, but cost can be justified when automation significantly reduces operational workload. It is most efficient in environments where manual instrumentation and correlation would be costly.
3. New Relic
 New Relic is a full-stack observability platform with strong APM roots and a unified telemetry model. It covers metrics, logs, traces, and user experience monitoring, with NRQL as the core query interface for exploration and dashboarding. New Relic’s biggest strength is balance: it provides a broad observability feature set without being as heavy or enterprise-locked as some competitors. It’s a common choice for teams that want a SaaS platform with strong developer experience and reasonable pricing transparency.
【Pros】
- Well-balanced full-stack observability feature set
- Good onboarding and developer experience
- NRQL makes exploration accessible for many teams
【Cons】
- Less differentiated for log-heavy, very high-volume environments
- Correlation depth below the very top-tier platforms
【Cost & Efficiency】
Consumption-based pricing is relatively predictable, with a free tier for smaller teams. Efficiency depends on managing log volume and sampling strategy.
4. Splunk
 Splunk remains one of the most powerful platforms for enterprise log analytics, security observability, and compliance-driven monitoring. While Splunk has expanded into metrics and traces, its strongest identity is still log-first: it excels at indexing, searching, and correlating massive log datasets, often in regulated industries where auditability and security workflows matter. Splunk is also tightly associated with SIEM and security operations, which makes it a common choice in organizations where observability and security are deeply intertwined.
【Pros】
- Extremely strong log investigation and security workflows
- Proven at enterprise scale with compliance maturity
- Powerful search language and correlation capabilities
【Cons】
- Cost scales aggressively with data volume
- Can be heavy to operate and administer
【Cost & Efficiency】
Splunk is one of the most expensive options for high ingestion volumes. It is cost-effective mainly when security and compliance workflows provide enough business value to justify the spend.
5. Elastic Observability
 Elastic Observability is built on the Elastic Stack and remains one of the most mature solutions for log-centric observability. Its biggest advantage is search: Elastic is extremely strong at quickly narrowing down logs, correlating events, and supporting investigative workflows. In many organizations, Elastic sits at the intersection of observability and security, because the same log data often powers both incident response and threat detection. Elastic supports metrics and traces as well, but its strongest differentiation is still search-driven log investigation at scale.
【Pros】
- Best-in-class log search and investigation experience
- Flexible deployment options (self-hosted or Elastic Cloud)
- Strong ecosystem for observability + security workflows
【Cons】
- Resource-intensive at scale (indexing is expensive)
- Requires tuning and lifecycle management to stay cost-efficient
【Cost & Efficiency】
Elastic costs scale with indexing volume and retention. Cost control depends on tiering (hot/warm/cold) and aggressive retention strategies.
6. OpenSearch
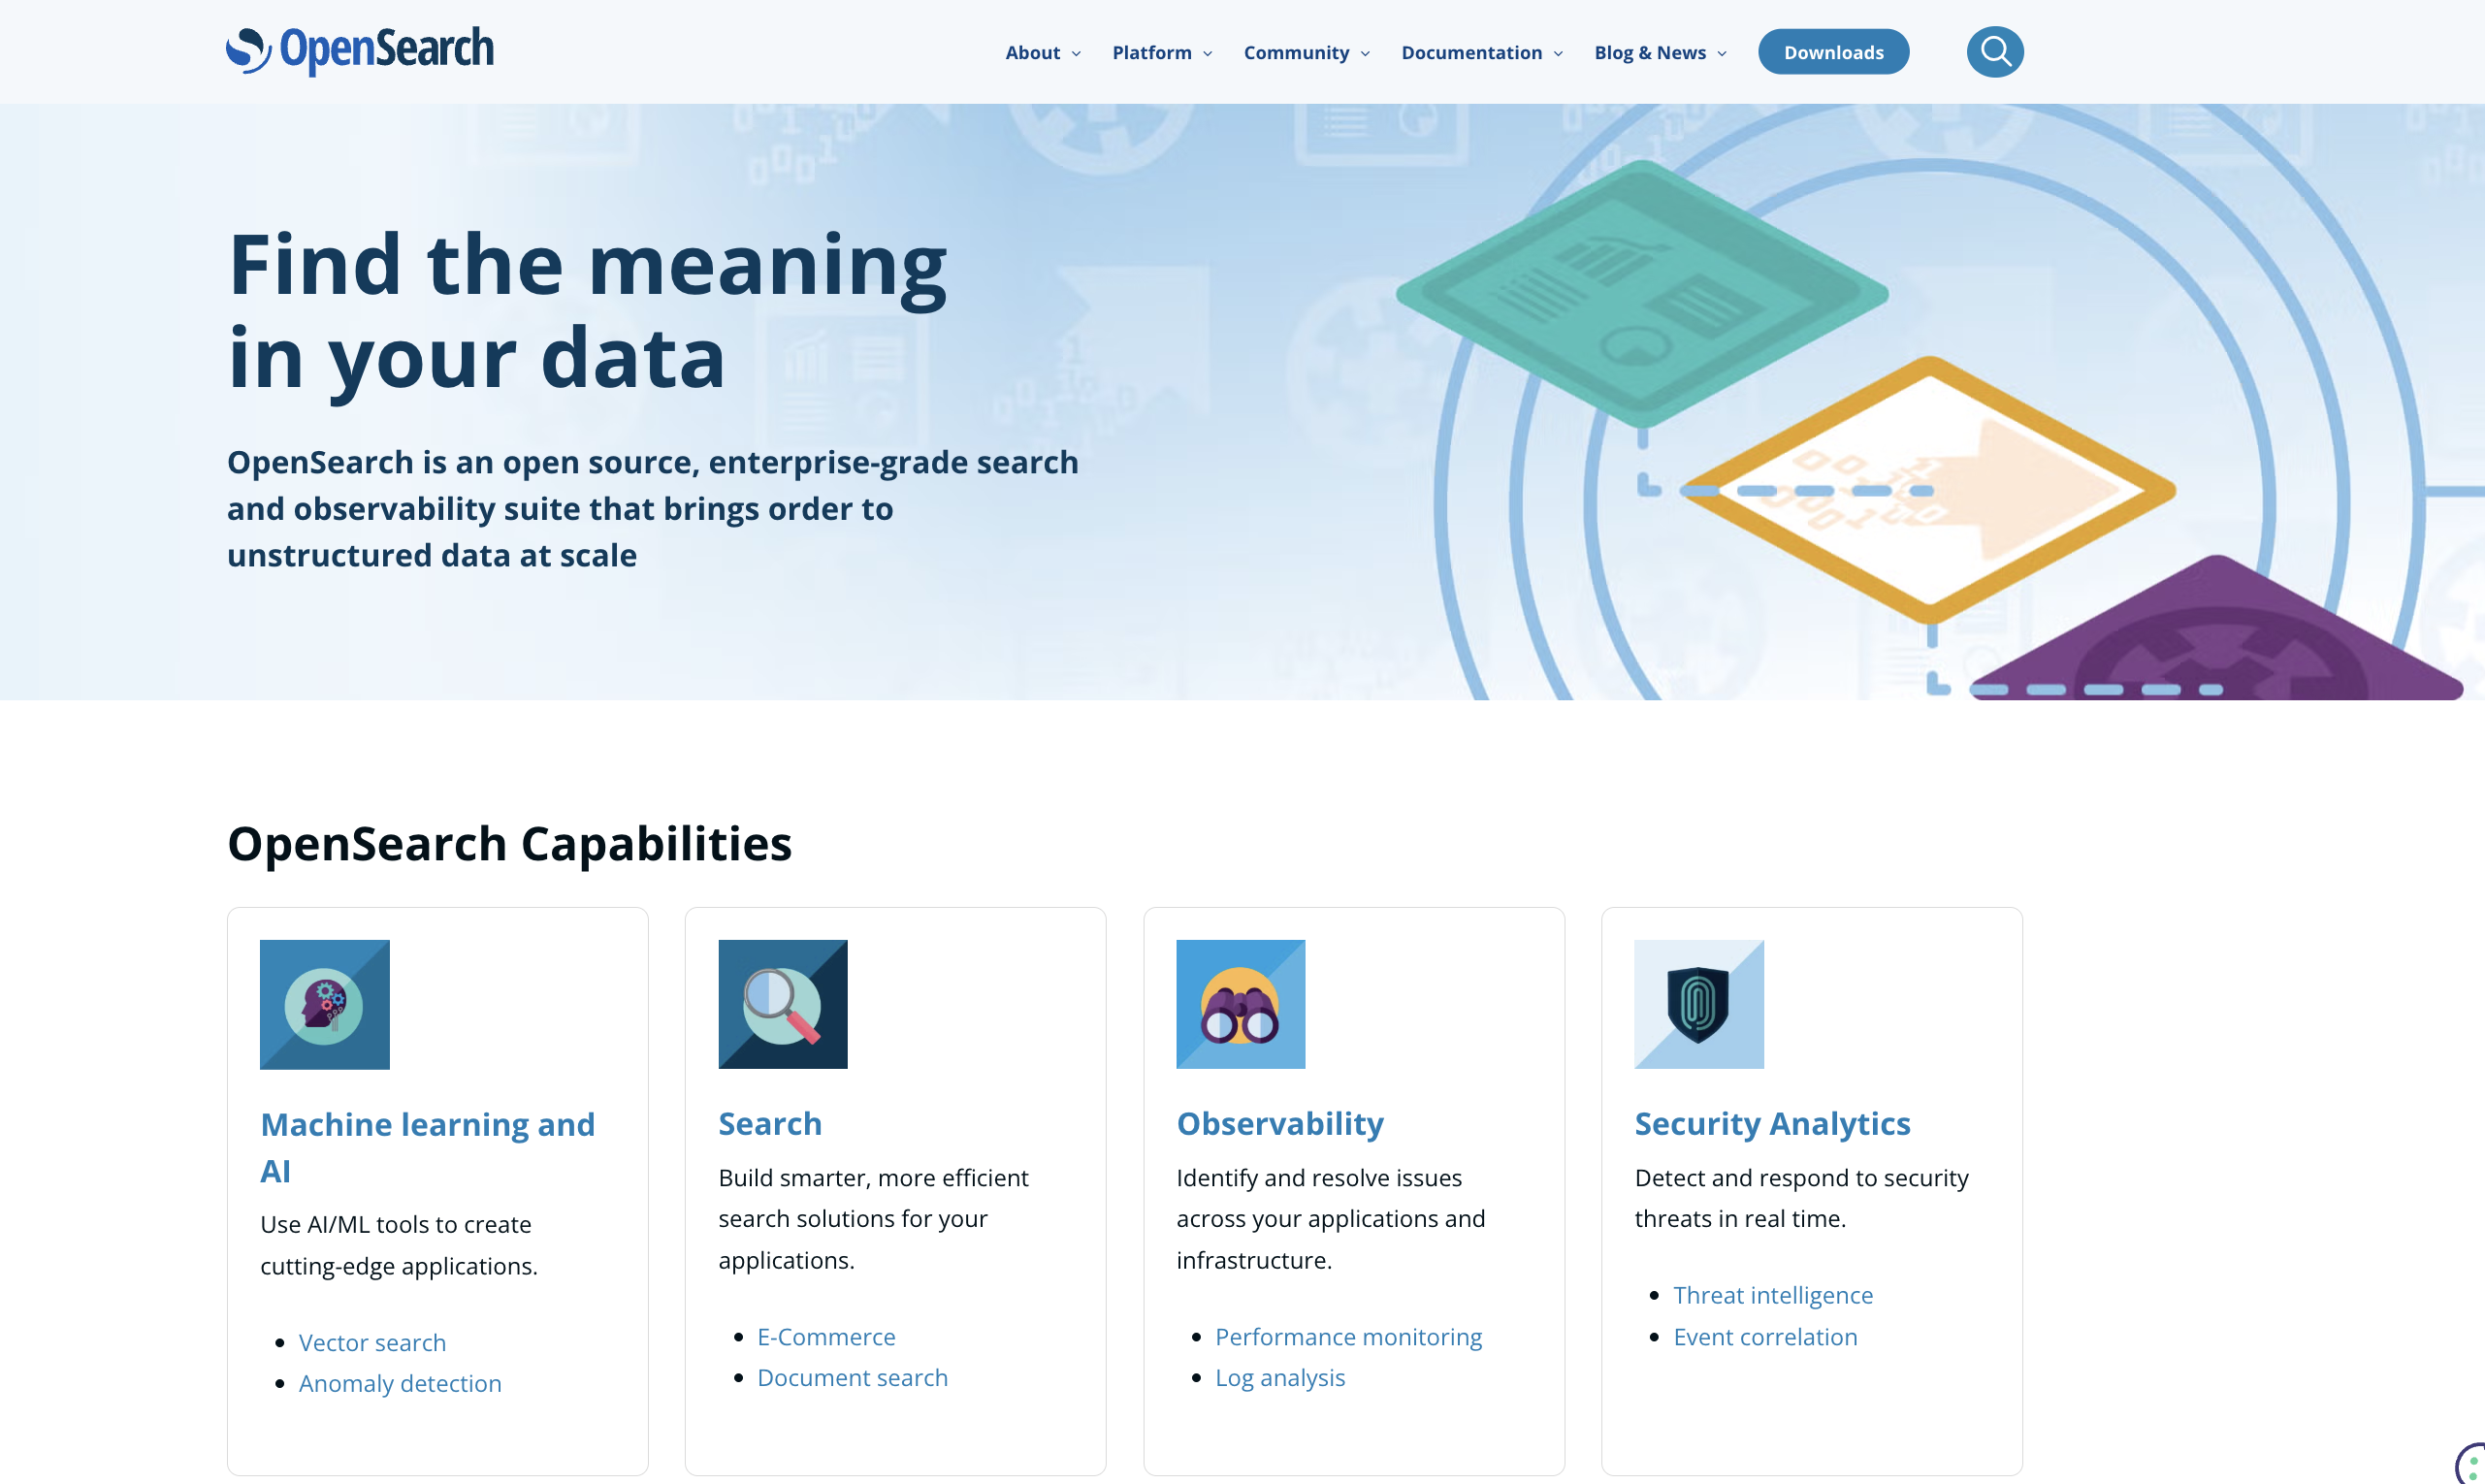 OpenSearch is an open-source search and analytics engine commonly used for log monitoring and observability pipelines, especially by teams that want full control over deployment and data retention. In observability use cases, OpenSearch is primarily a log storage and search layer, enabling fast full-text search, filtering, and aggregations over time-based data. While it can also handle traces and metrics via plugins, it is most commonly adopted as a log-first observability backend. It also provides dashboards and alerting via plugins, making it a viable foundation for teams building an open-source observability stack without relying on commercial SaaS platforms.
【Pros】
- Open-source and self-hostable
- Strong log search and filtering capabilities
- Flexible schema and indexing strategies
【Cons】
- Operational overhead grows quickly at scale
- Performance and cost depend heavily on index design and tuning
【Cost & Efficiency】
OpenSearch gives strong licensing cost control, but storage and compute costs can rise quickly with high ingestion. Efficiency depends on lifecycle management, retention policies, and careful index strategy.
7. Grafana Cloud
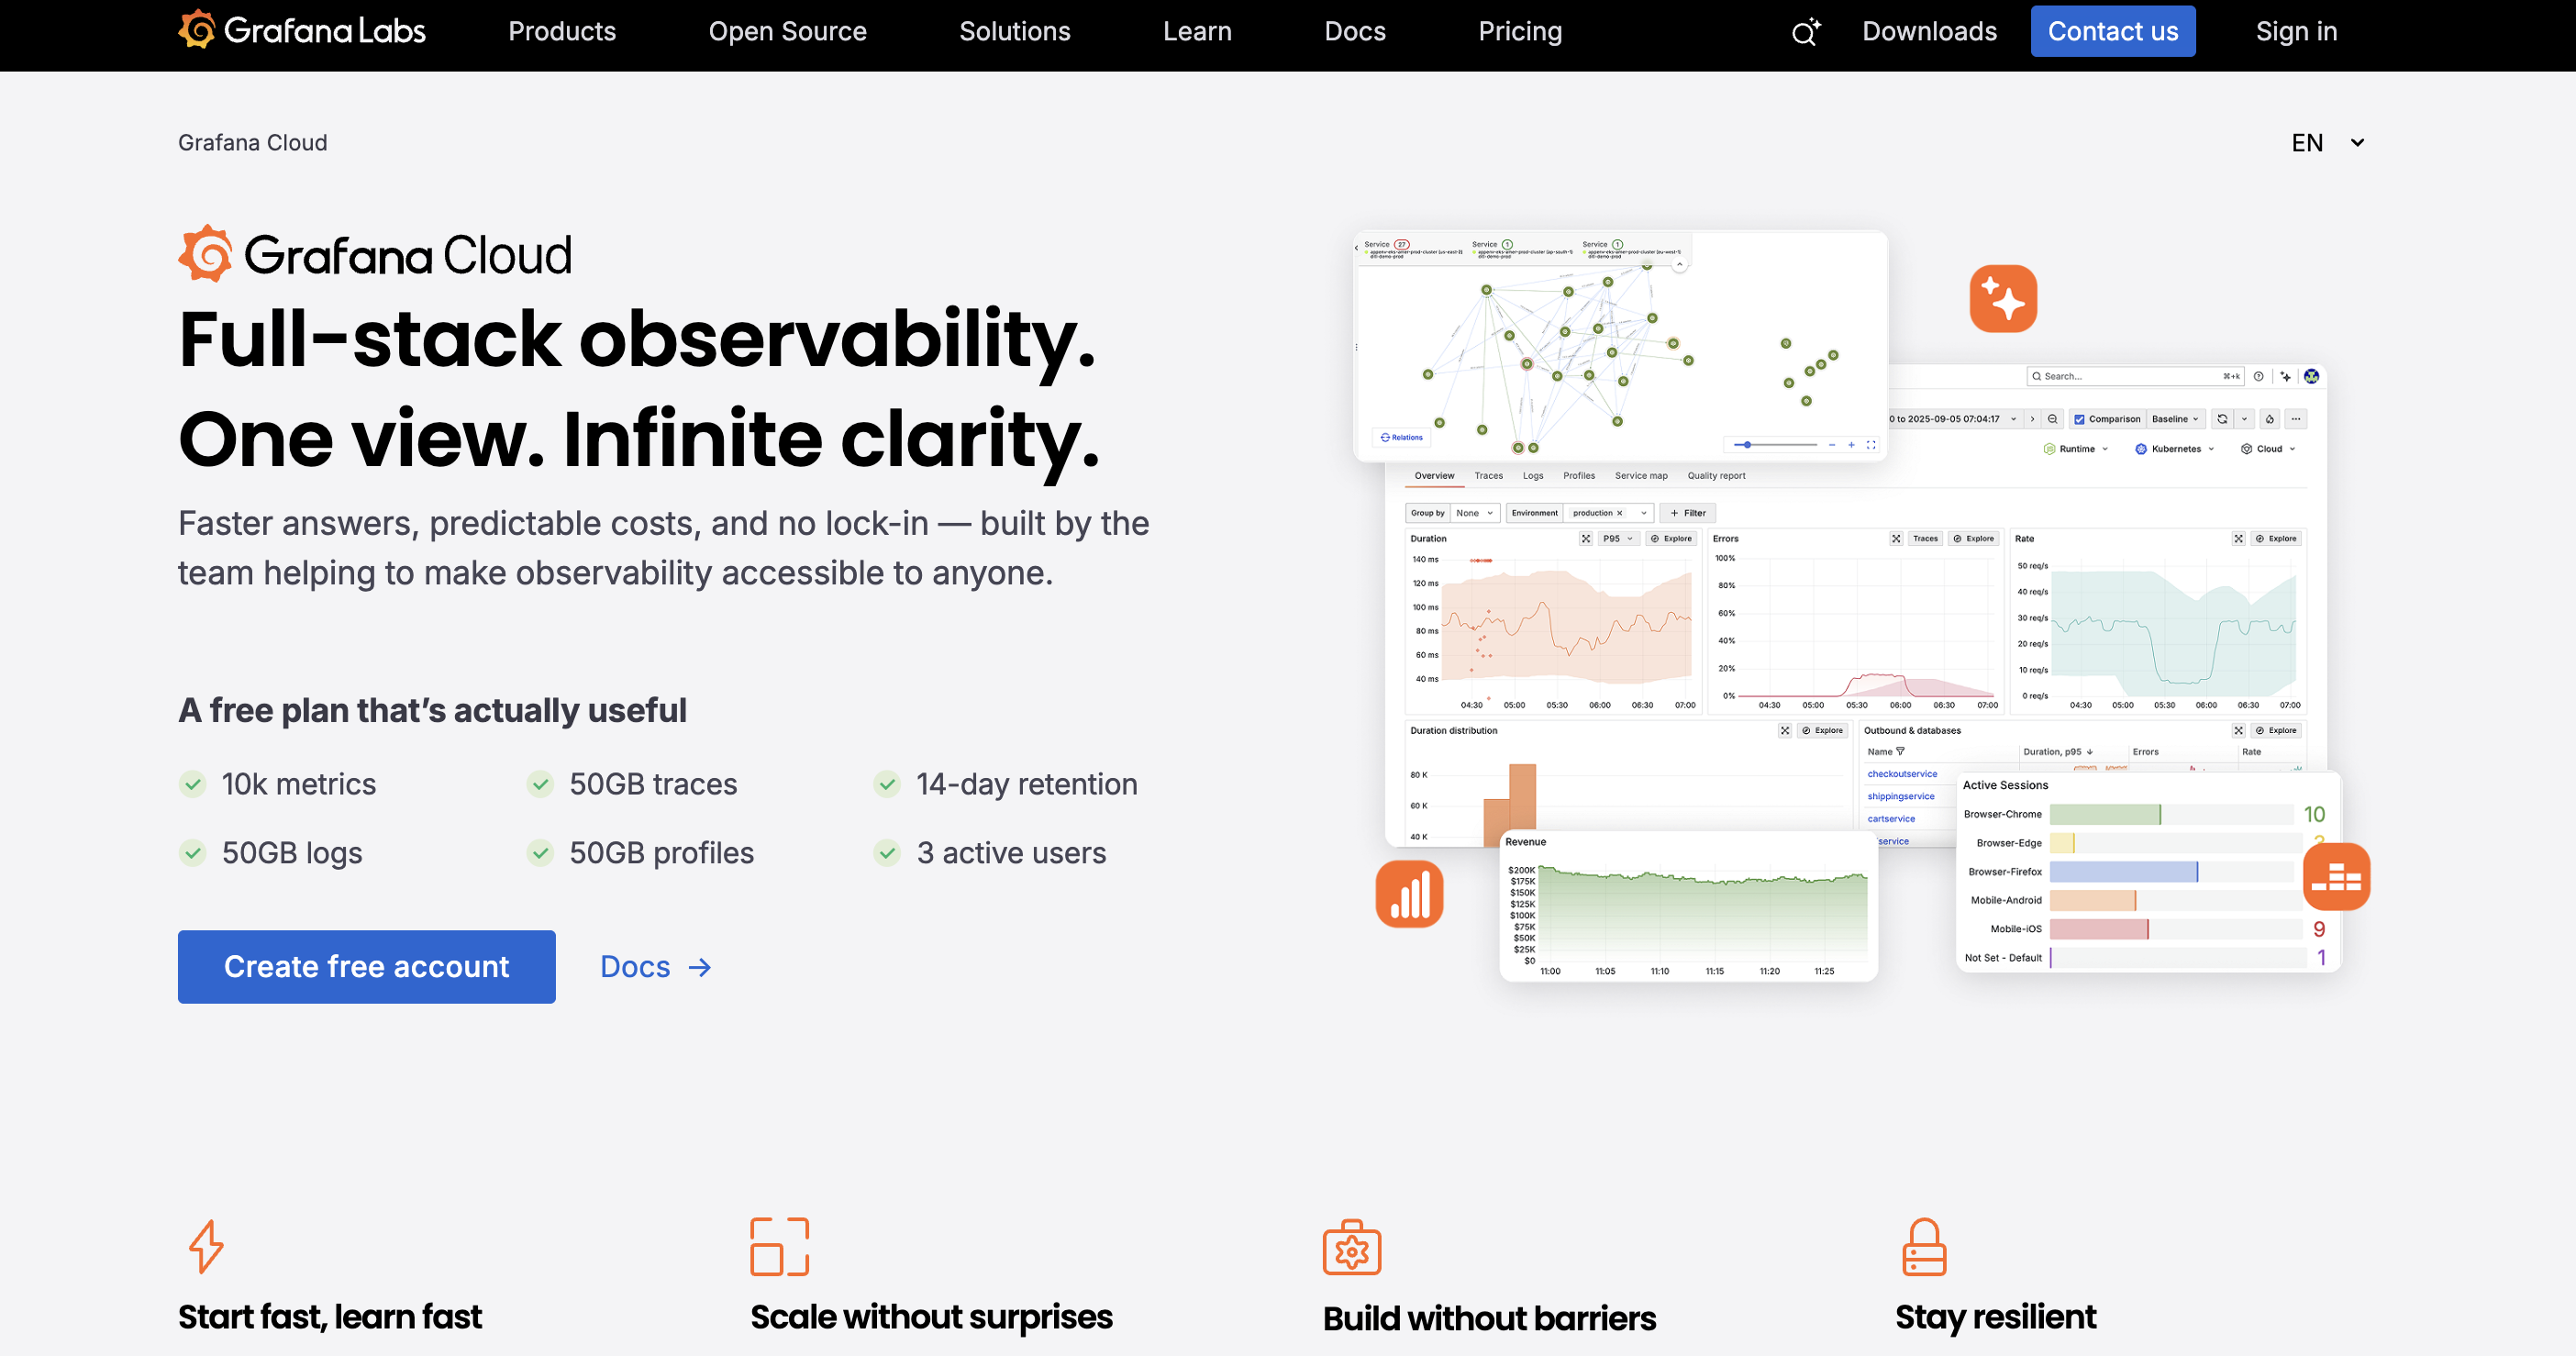 Grafana Cloud is the managed SaaS version of the popular Grafana ecosystem, bundling Prometheus-compatible metrics (Mimir), log storage (Loki), tracing (Tempo), profiling (Pyroscope), and dashboards into a single hosted platform. Unlike the open-source Grafana setup that requires teams to operate multiple components themselves, Grafana Cloud reduces operational overhead while preserving the flexibility of the underlying open-source stack.
Its biggest strength is correlation and visualization. Teams can move from a metric spike to related logs, then to traces, all within the same UI. Because the platform is built around widely adopted open standards such as Prometheus and OpenTelemetry, it integrates naturally into modern cloud-native environments without forcing proprietary instrumentation.
Grafana Cloud is especially attractive for teams that already rely on Prometheus-style metrics but want a hosted backend and unified workflow without managing storage, scaling, and upgrades themselves.
【Pros】
- Strong dashboards and visualization experience
- Built on open standards (Prometheus, OpenTelemetry)
- Lower operational overhead compared to self-managed Grafana stacks
【Cons】
- Log search is optimized for observability workflows, not general-purpose full-text analytics
- Costs increase with ingestion volume and retention
- Advanced analysis still depends on underlying components (Loki, Tempo, etc.)
【Cost & Efficiency】
Grafana Cloud offers tiered pricing based on ingestion and retention. It can be cost-efficient for cloud-native teams compared to operating a full open-source stack, but large-scale log ingestion requires careful retention and sampling strategies to control spend.
8. VeloDB
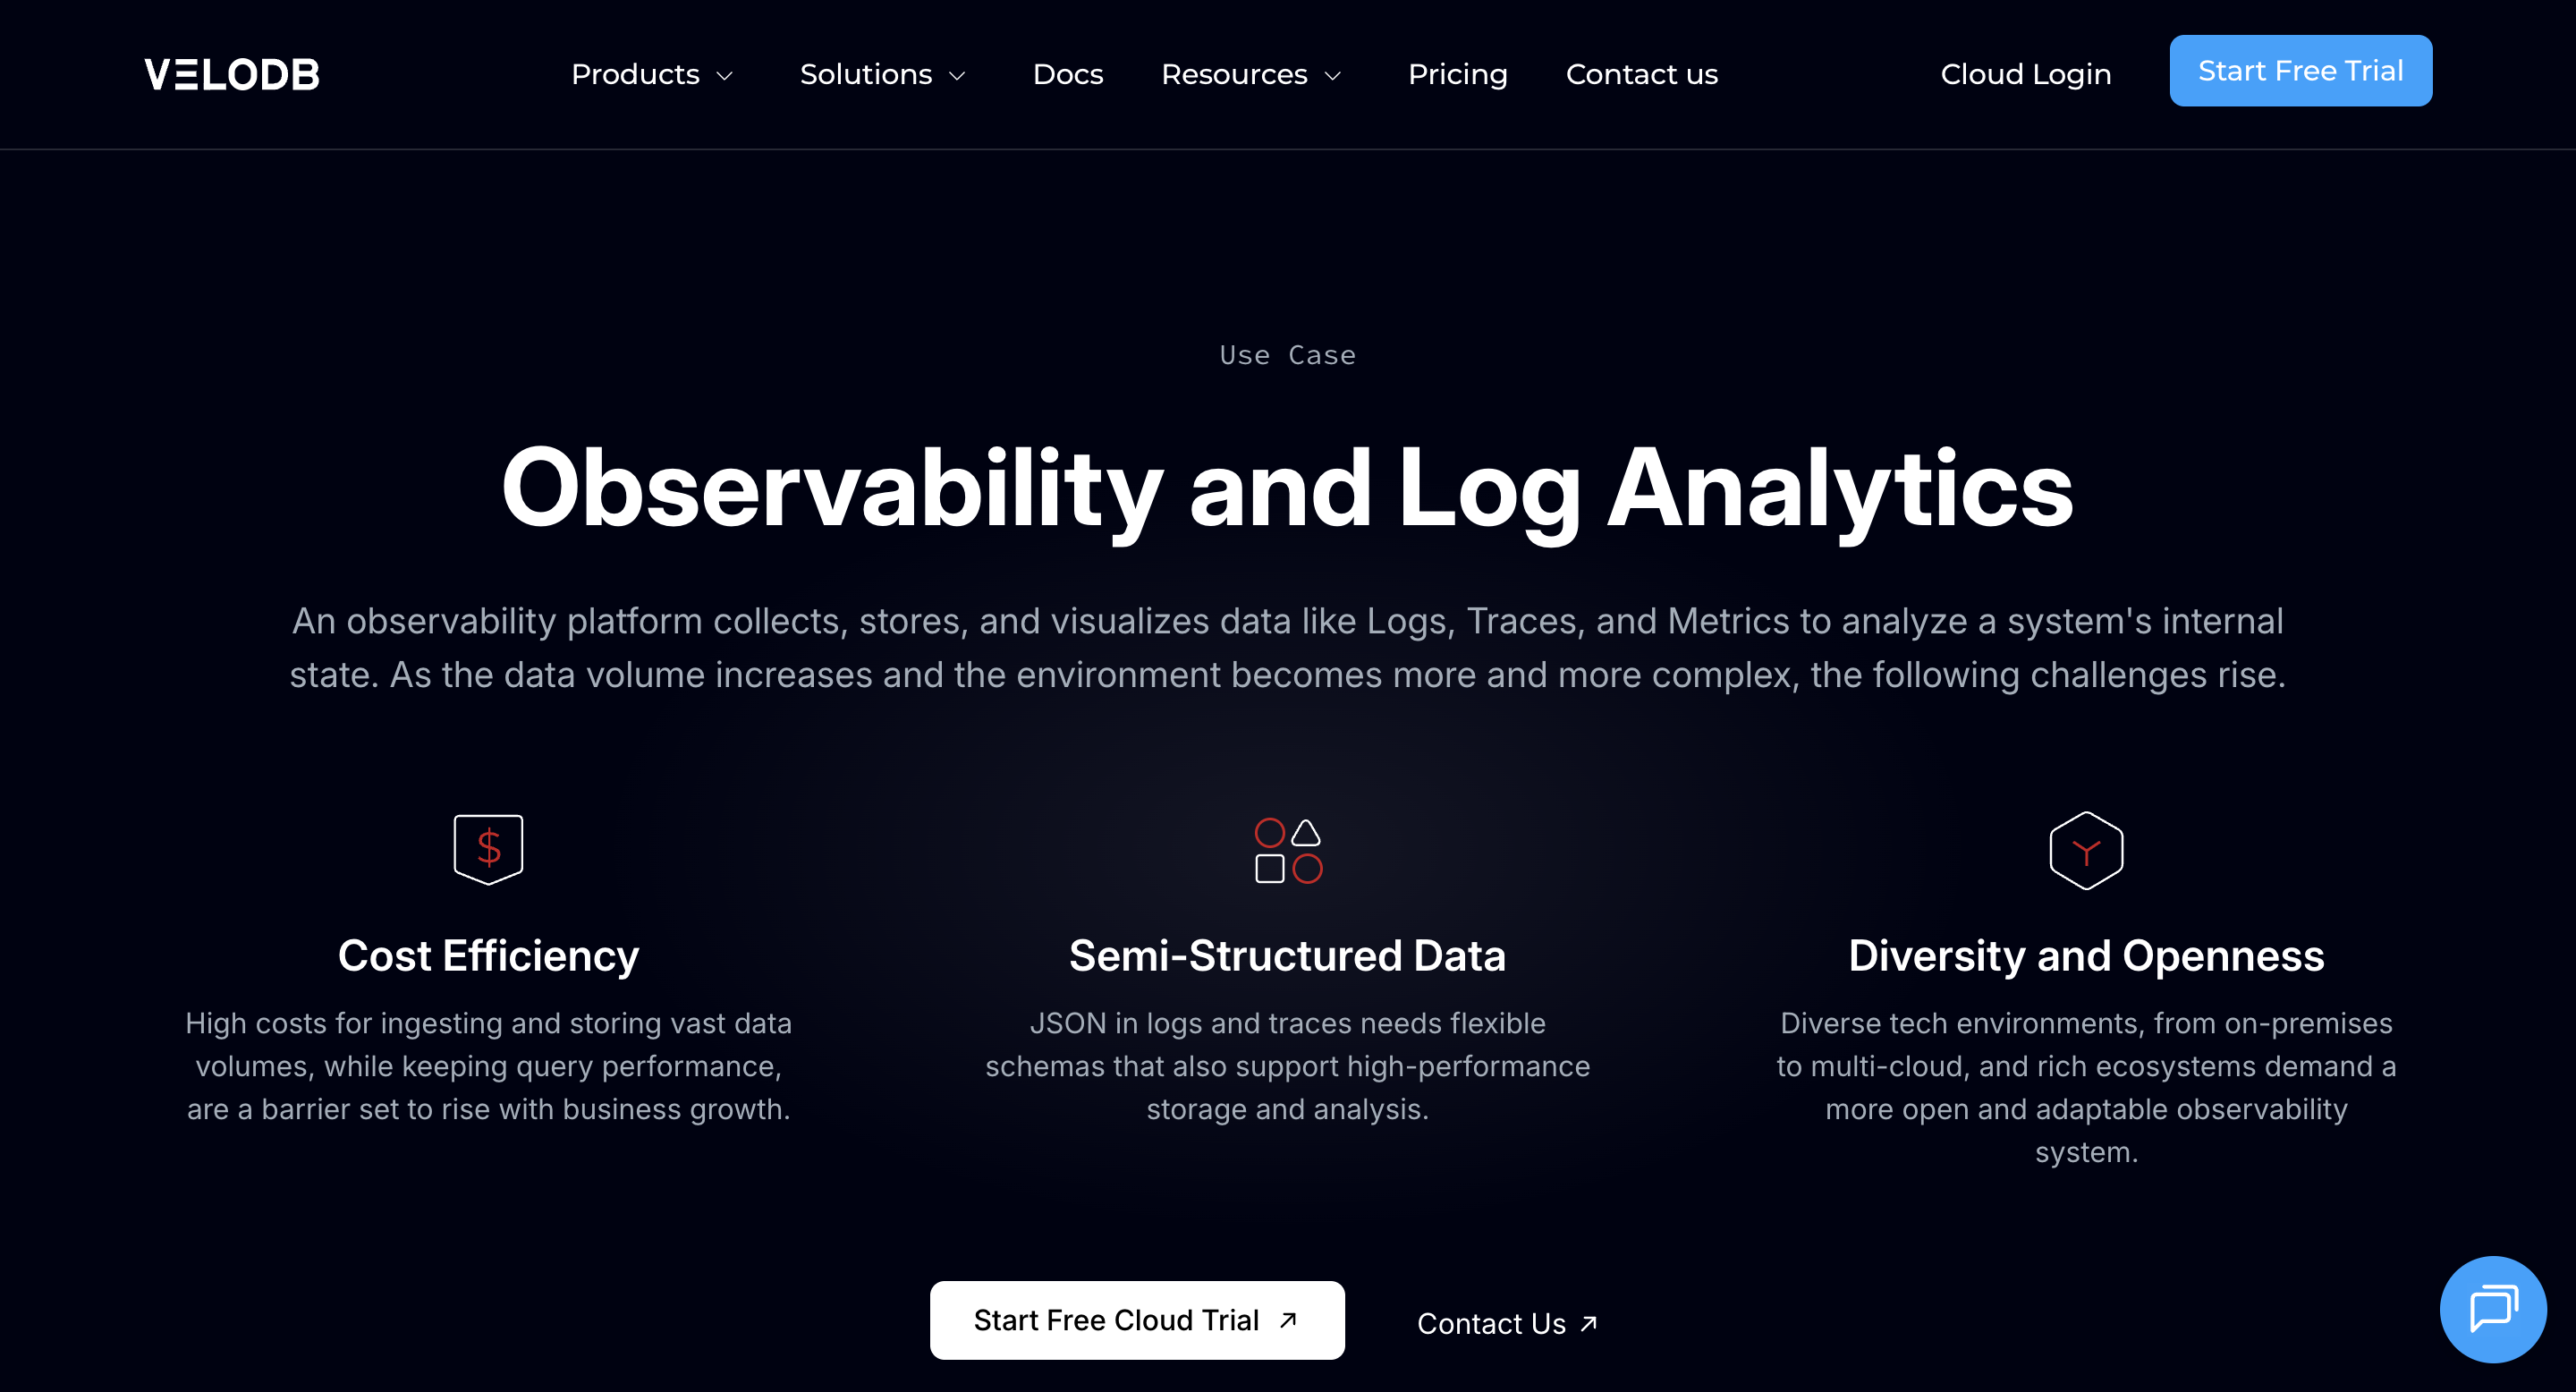 VeloDB is not a traditional observability tool like Datadog, Dynatrace, or Splunk. In modern observability stacks, it plays the role of a high-performance telemetry analytics backend rather than an end-to-end monitoring product. It’s a real-time analytics database (based on Apache Doris) that teams use as the analytical backbone behind observability workflows. Where it shines is when your observability data becomes too large or too high-cardinality for typical log-first tools to query efficiently. VeloDB supports sub-second SQL queries over massive telemetry datasets, handles high-concurrency dashboard workloads, and makes it practical to slice and correlate signals across dimensions like service, region, user cohort, device ID, firmware version, or deployment. It also supports semi-structured event payloads through native VARIANT, which matters in real observability pipelines where schemas evolve constantly.
【Pros】
- Excellent for deep, ad-hoc observability analysis at scale
- Strong performance on high-cardinality telemetry data
- SQL interface + reproducible historical analysis workflows
【Cons】
- Focused feature set compared to full observability platforms
- Less integrated end-to-end workflows than commercial all-in-one tools
【Cost & Efficiency】
VeloDB is typically cost-efficient for large-scale observability analytics because it’s built for OLAP compression and fast interactive queries. ROI is strongest when your bottleneck becomes query latency, concurrency, or “observability tax.”
FAQ
What are observability platforms?
Observability platforms are systems that provide an end-to-end workflow for collecting, storing, analyzing, and acting on telemetry data—typically across metrics, logs, and traces. Unlike single-purpose tools, platforms usually include ingestion pipelines, dashboards, alerting, and correlation features in one product. In practice, an observability platform is designed to help teams go from “something is wrong” to “here’s the root cause” with minimal tool switching.
What’s the difference between monitoring and observability?
Monitoring checks predefined conditions—such as whether a service is up, a metric crosses a threshold, or an error rate spikes. Observability is broader: it helps explain why systems behave the way they do, including failure modes you didn’t anticipate. If monitoring tells you that something is broken, observability helps you understand what changed, where it changed, and why it matters.
Do I need one observability tool or multiple tools?
Most teams end up using multiple tools, even if they start with one platform. A single platform can work well early on, but as systems scale, different needs emerge—log search, tracing, visualization, cost control, or deep analytics. In practice, the most common setup is a primary platform for collection and workflows, plus specialized tools for high-volume logs, tracing, or interactive analysis.
Is OpenTelemetry replacing observability tools?
No—OpenTelemetry is not an observability tool. It is a standard for collecting and exporting telemetry data (metrics, logs, traces). OpenTelemetry makes instrumentation more portable and reduces vendor lock-in, but you still need a backend platform to store, query, visualize, and alert on the data. In many stacks, OpenTelemetry becomes the “collection layer,” while tools like Datadog, Grafana, Elastic, or Splunk provide the analysis and workflows.