OpenTelemetry is open-source and community-driven observability standard that consists of a set of specifications, language-specific SDKs, and a vendor-neutral collector. OpenTelemetry SDKs support auto instrumentation for many popular programming languages without little or no code changes. OpenTelemetry is widely adopted by large organizations and supported by many observability vendors. To help users get started quickly, OpenTelemetry also provides a comprehensive demo that showcases end-to-end observability for an e-commerce application composed of around twenty microservices.
What is Observability
Observability is the ability to understand the internal state of a system by examining its external outputs. It answers a fundamental question: what is happening inside the system, and why?
Observability plays a critical role in modern software systems. It is essential for alerting, troubleshooting, performance analysis, capacity planning, and reliability engineering. Without sufficient observability, engineers are forced to rely on guesswork when diagnosing issues or optimizing system behavior.
In the context of computer and IT systems, observability refers to the practice of collecting, processing, storing, and analyzing telemetry data to gain insights into a system’s health, performance, and behavior. As systems become more distributed, dynamic, and cloud-native, observability has evolved from a “nice to have” feature into a core infrastructure capability. This evolution becomes even more critical in the era of AI applications, where observability extends beyond traditional systems to include large language models. In such contexts, LLM Observability focuses on monitoring model behavior, prompt performance, latency, and output quality to ensure reliable and controllable AI systems.
What is Telemetry Data
Telemetry data lies at the heart of observability. The internal state of a system—such as performance, reliability, and resource utilization—is inferred from telemetry signals emitted by the system itself.
In IT and software systems, telemetry data is continuously generated by applications, infrastructure, and platforms, and then collected and analyzed to provide visibility into system behavior.
The three most important and widely used types of telemetry data are metrics, logs, and traces.
Metrics
Metrics are numerical measurements that represent the value of a specific dimension at a given point in time. Common examples include CPU usage, memory consumption, request rate, error count, and temperature.
Metrics are typically categorized into different types:
- Counter: A monotonically increasing value that only goes up, such as the total number of requests or errors.
- Gauge: A value that represents the current state and can go up or down, such as memory usage or CPU utilization.
Metrics are efficient to store and query, making them ideal for monitoring trends, triggering alerts, and capacity planning.
Logs
Logs are textual records generated by applications and systems to describe events that occur during execution. A log entry usually contains structured or semi-structured fields such as:
- When the event occurred (timestamp)
- What happened (log message or body)
- Who or where the event came from (service name, component, or request ID)
Modern logs are often emitted in structured formats such as JSON, which makes them easier to parse, search, and analyze programmatically. Logs are especially useful for debugging, auditing, and forensic analysis.
Traces
Traces capture the end-to-end journey of a single request as it flows through a distributed system. A trace is composed of multiple spans, each representing an individual operation or step.
- A root span represents the entry point of the request.
- Child spans represent downstream calls, such as database queries or inter-service communication.
Each span records timing information and contextual metadata, making traces invaluable for understanding latency, service dependencies, and bottlenecks in microservices architectures.
Individually, metrics, logs, and traces each provide a partial view of system behavior. When combined and correlated, they enable true observability by answering both what happened and why it happened.
This need for unified telemetry is one of the key reasons why OpenTelemetry was created—to provide a standard way to generate, collect, and correlate telemetry data across systems.
What is OpenTelemetry
OpenTelemetry (often abbreviated as OTel) is an open-source observability framework and toolkit designed to help developers and operators collect, generate, and export telemetry data from their systems. It consists of a set of specifications, language-specific SDKs, and a vendor-neutral collector, covering the three pillars of observability: traces, metrics, and logs.
One of the most outstanding advantages of OpenTelemetry is that it is community-driven and vendor-agnostic. The project is governed by the Cloud Native Computing Foundation (CNCF) and represents the merger of two earlier projects: OpenTracing and OpenCensus. By unifying these efforts, OpenTelemetry aims to establish a single, consistent standard for observability across the industry.
Today, OpenTelemetry is widely regarded as the de facto industry standard for observability. An increasing number of open-source and commercial observability products natively support OpenTelemetry, including monitoring systems, APM platforms, logging backends, and cloud providers. This rapid adoption makes OpenTelemetry a foundational component of modern cloud-native and distributed systems.
Importantly, OpenTelemetry itself does not store or visualize telemetry data. Instead, it focuses on defining standards and providing tooling for data collection and transmission, leaving storage, querying, and visualization to downstream observability backends.
Key Features of OpenTelemetry
 Beyond standard specifications, OpenTelemetry's key features focus on making observability easy to adopt and operate across diverse environments, from broad language support to flexible data collection and processing.
1. Broad Language Support
OpenTelemetry offers official SDKs for a wide range of programming languages, including: C++, C#/.NET, Go, Java, JavaScript, Python, PHP, Rust, Ruby, Swift, Erlang and more.
These SDKs can generate and collect logs, traces, and metrics in a consistent and standardized way.
2. Zero-Code Auto Instrumentation
OpenTelemetry supports zero-code (or low-code) auto instrumentation for popular languages such as .NET, Go, Java, JavaScript, Python. This means existing applications can be observed without modifying application code, significantly reducing adoption cost.
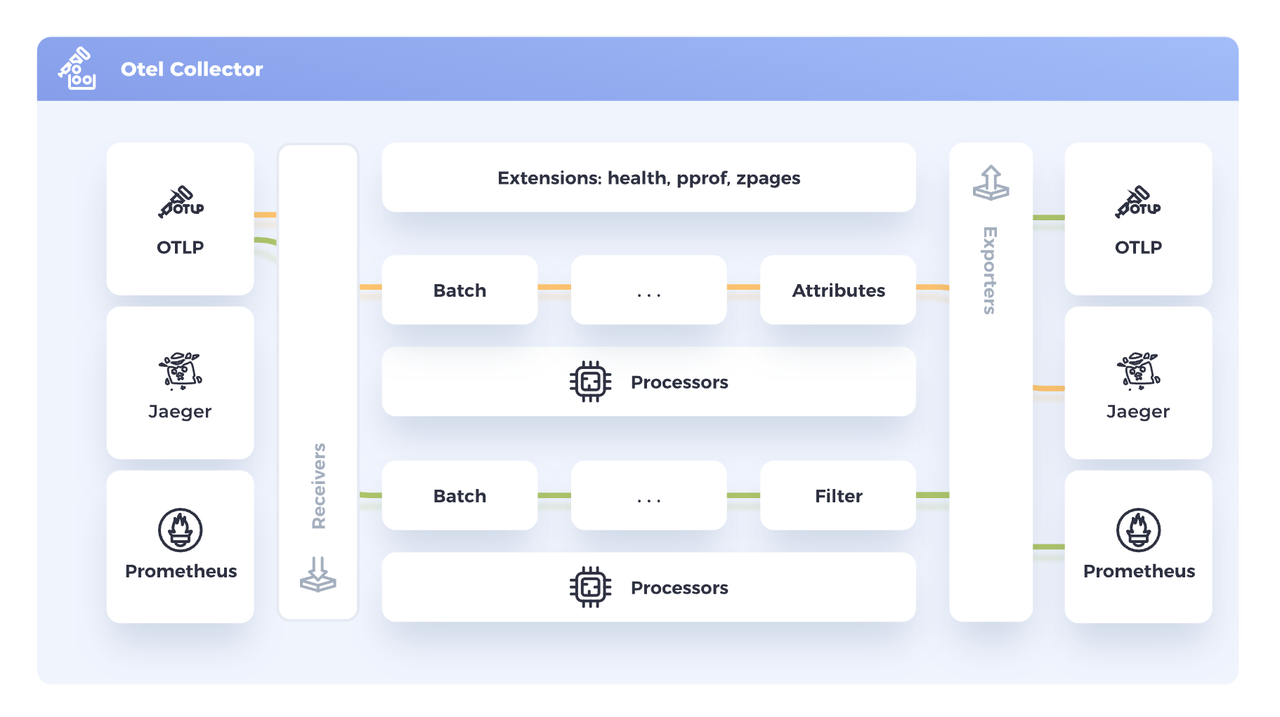
3. Powerful OpenTelemetry Collector
The OpenTelemetry Collector provides a reference implementation for receiving, processing, and exporting telemetry data. It works with observability tools such as Jaeger, Prometheus through the OTLP and HTTP protocols. It provides useful capabilities such as file tailing, batching, filtering, queueing, which are vendor-agnostic. All of these features are vendor-agnostic, making the collector a core building block in modern observability pipelines.
Benefits of Using OpenTelemetry
Building an observability system based on OpenTelemetry brings several important benefits.
1. Standardized Observability APIs
With OpenTelemetry, developers only need to learn one unified set of APIs and concepts. This eliminates the need to understand different, incompatible observability models across tools and vendors.
2. Ease of Use
Out-of-the-box instrumentation—especially auto instrumentation—allows teams to gain observability insights quickly. The vendor-neutral collector further simplifies data processing and tool composition.
3. Vendor Agnostic by Design
OpenTelemetry decouples instrumentation from storage and visualization. This allows organizations to switch observability vendors without rewriting code or rebuilding data pipelines, while retaining full ownership of their telemetry data.
4. Composable Observability Stack
Users can freely compose the observability stack that best fits their environment, choosing:
- Different storage backends
- Multiple visualization tools
- Hybrid or multi-cloud deployments
5. Highly Extensible
OpenTelemetry is designed for extensibility. Developers can implement:
- Custom instrumentation libraries
- Custom collector receivers and processors
- Custom storage backend integrations.
This flexibility is especially useful for emerging technologies or specialized environments.
How Does OpenTelemetry Work
 At a high level, OpenTelemetry defines the specifications and protocols for different components in an observability system. Based on these specifications, OpenTelemetry provides official SDK implementations for many programming languages, while observability vendors and open-source projects implement storage backends and visualization frontends.
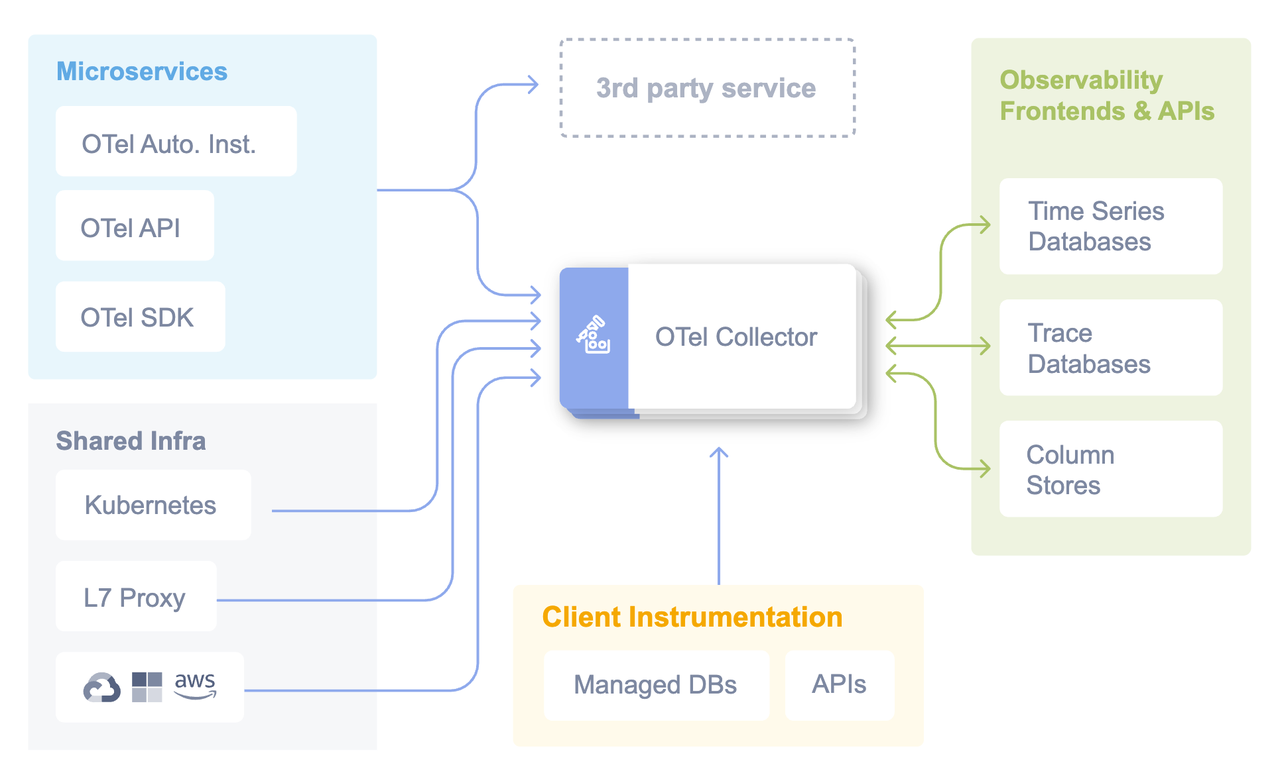
A typical observability system built on OpenTelemetry follows a layered architecture.
The key components in an OpenTelemetry-based observability architecture include:
1. Observed Objects
These are the entities being monitored, such as:
- Hosts and virtual machines
- Containers and Kubernetes pods
- Processes and applications
- Microservices and APIs
- Devices and edge components
2. OpenTelemetry Instrumentation SDKs
The OpenTelemetry SDKs run inside or alongside the observed objects. They are responsible for:
- Creating spans, metrics, and log records
- Managing context propagation
- Performing sampling and batching
- In addition to official SDKs, developers can also implement custom instrumentation clients based on the OpenTelemetry specification.
3. OpenTelemetry Collector
The OpenTelemetry Collector acts as a vendor-neutral telemetry proxy. It receives telemetry data (logs, traces, metrics) from SDKs, processes them, and exports them to one or more storage backends. Typical collector responsibilities include:
- Receiving data via OTLP, HTTP, or other protocols
- Batching and queueing
- Filtering and sampling
- Transforming data formats
- Exporting to multiple backends simultaneously
4. Observability Storage Backend
Storage backends persist telemetry data and provide query interfaces. Examples include:
- Prometheus (metrics)
- Jaeger (traces)
- Apache Doris
- VeloDB
- Other OLAP databases or time-series systems
5. Observability Visualization and Applications
Visualization frontends such as Grafana query telemetry data from storage backends and present it in a human-friendly format, including dashboards, charts, and tables.
Other observability applications, such as alert managers and anomaly detection systems, also rely on backend queries to generate actionable insights.
Common Use Cases of OpenTelemetry
OpenTelemetry is widely used across industries and system architectures.
1. Distributed Tracing
In a microservices architecture, a single user request might pass through 20 different services. OTel's distributed tracing tracks the request's journey, helping engineers identify exactly which service is causing latency or throwing errors.
2. Application Performance Monitoring (APM)
By collecting metrics (CPU, Memory, Garbage Collection) alongside traces, OTel provides a holistic view of application health. It helps in identifying memory leaks or inefficient code paths before they cause a crash.
3. Metrics and Infrastructure Monitoring
OTel can tail log files or capture stdout, attach metadata (like Container ID or Cloud Region), and ship them to a high-performance backend like VeloDB for full-text search and analysis.
4. Log Collection and Analysis
OpenTelemetry can collect telemetry from the underlying K8s infrastructure, allowing you to correlate application performance drops with node-level issues like disk pressure or network congestion.
5. Root Cause Analysis
When an incident occurs, OTel allows SREs to "drill down." You can start at a high-level alert (Metric), jump to the specific traces during that time (Trace), and see the exact error messages recorded at that moment (Logs).
Getting Started with OpenTelemetry
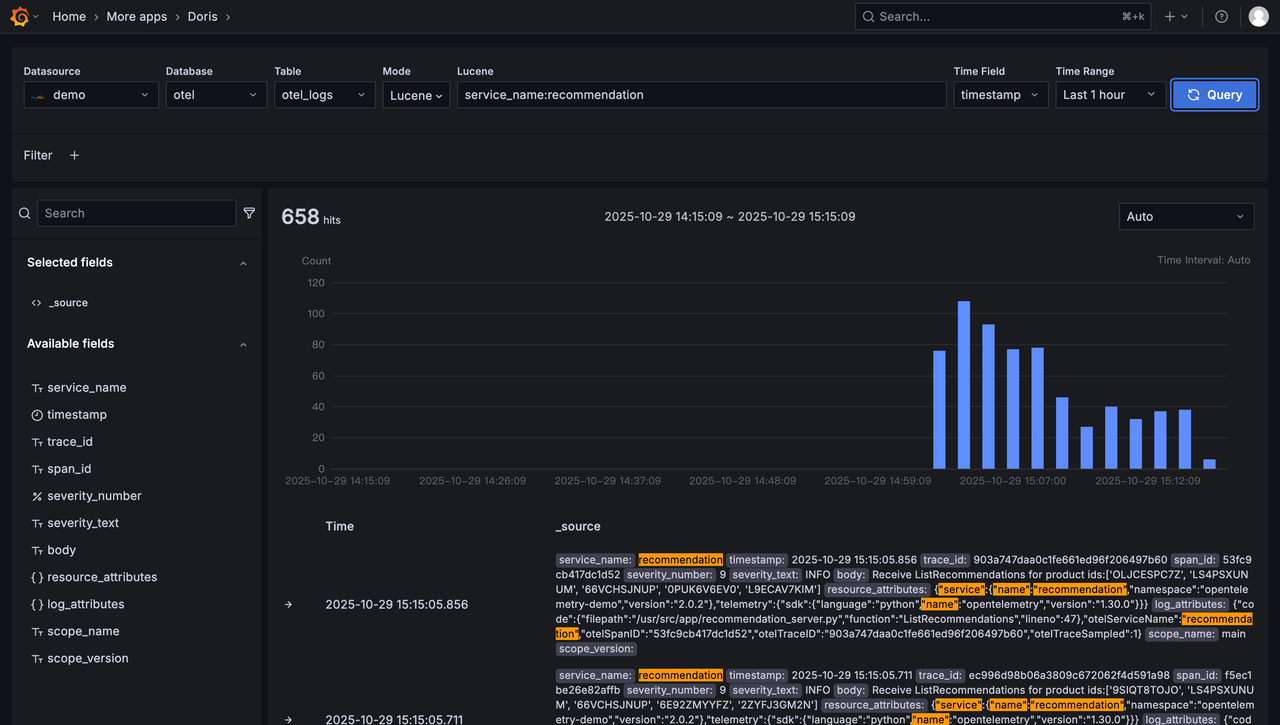
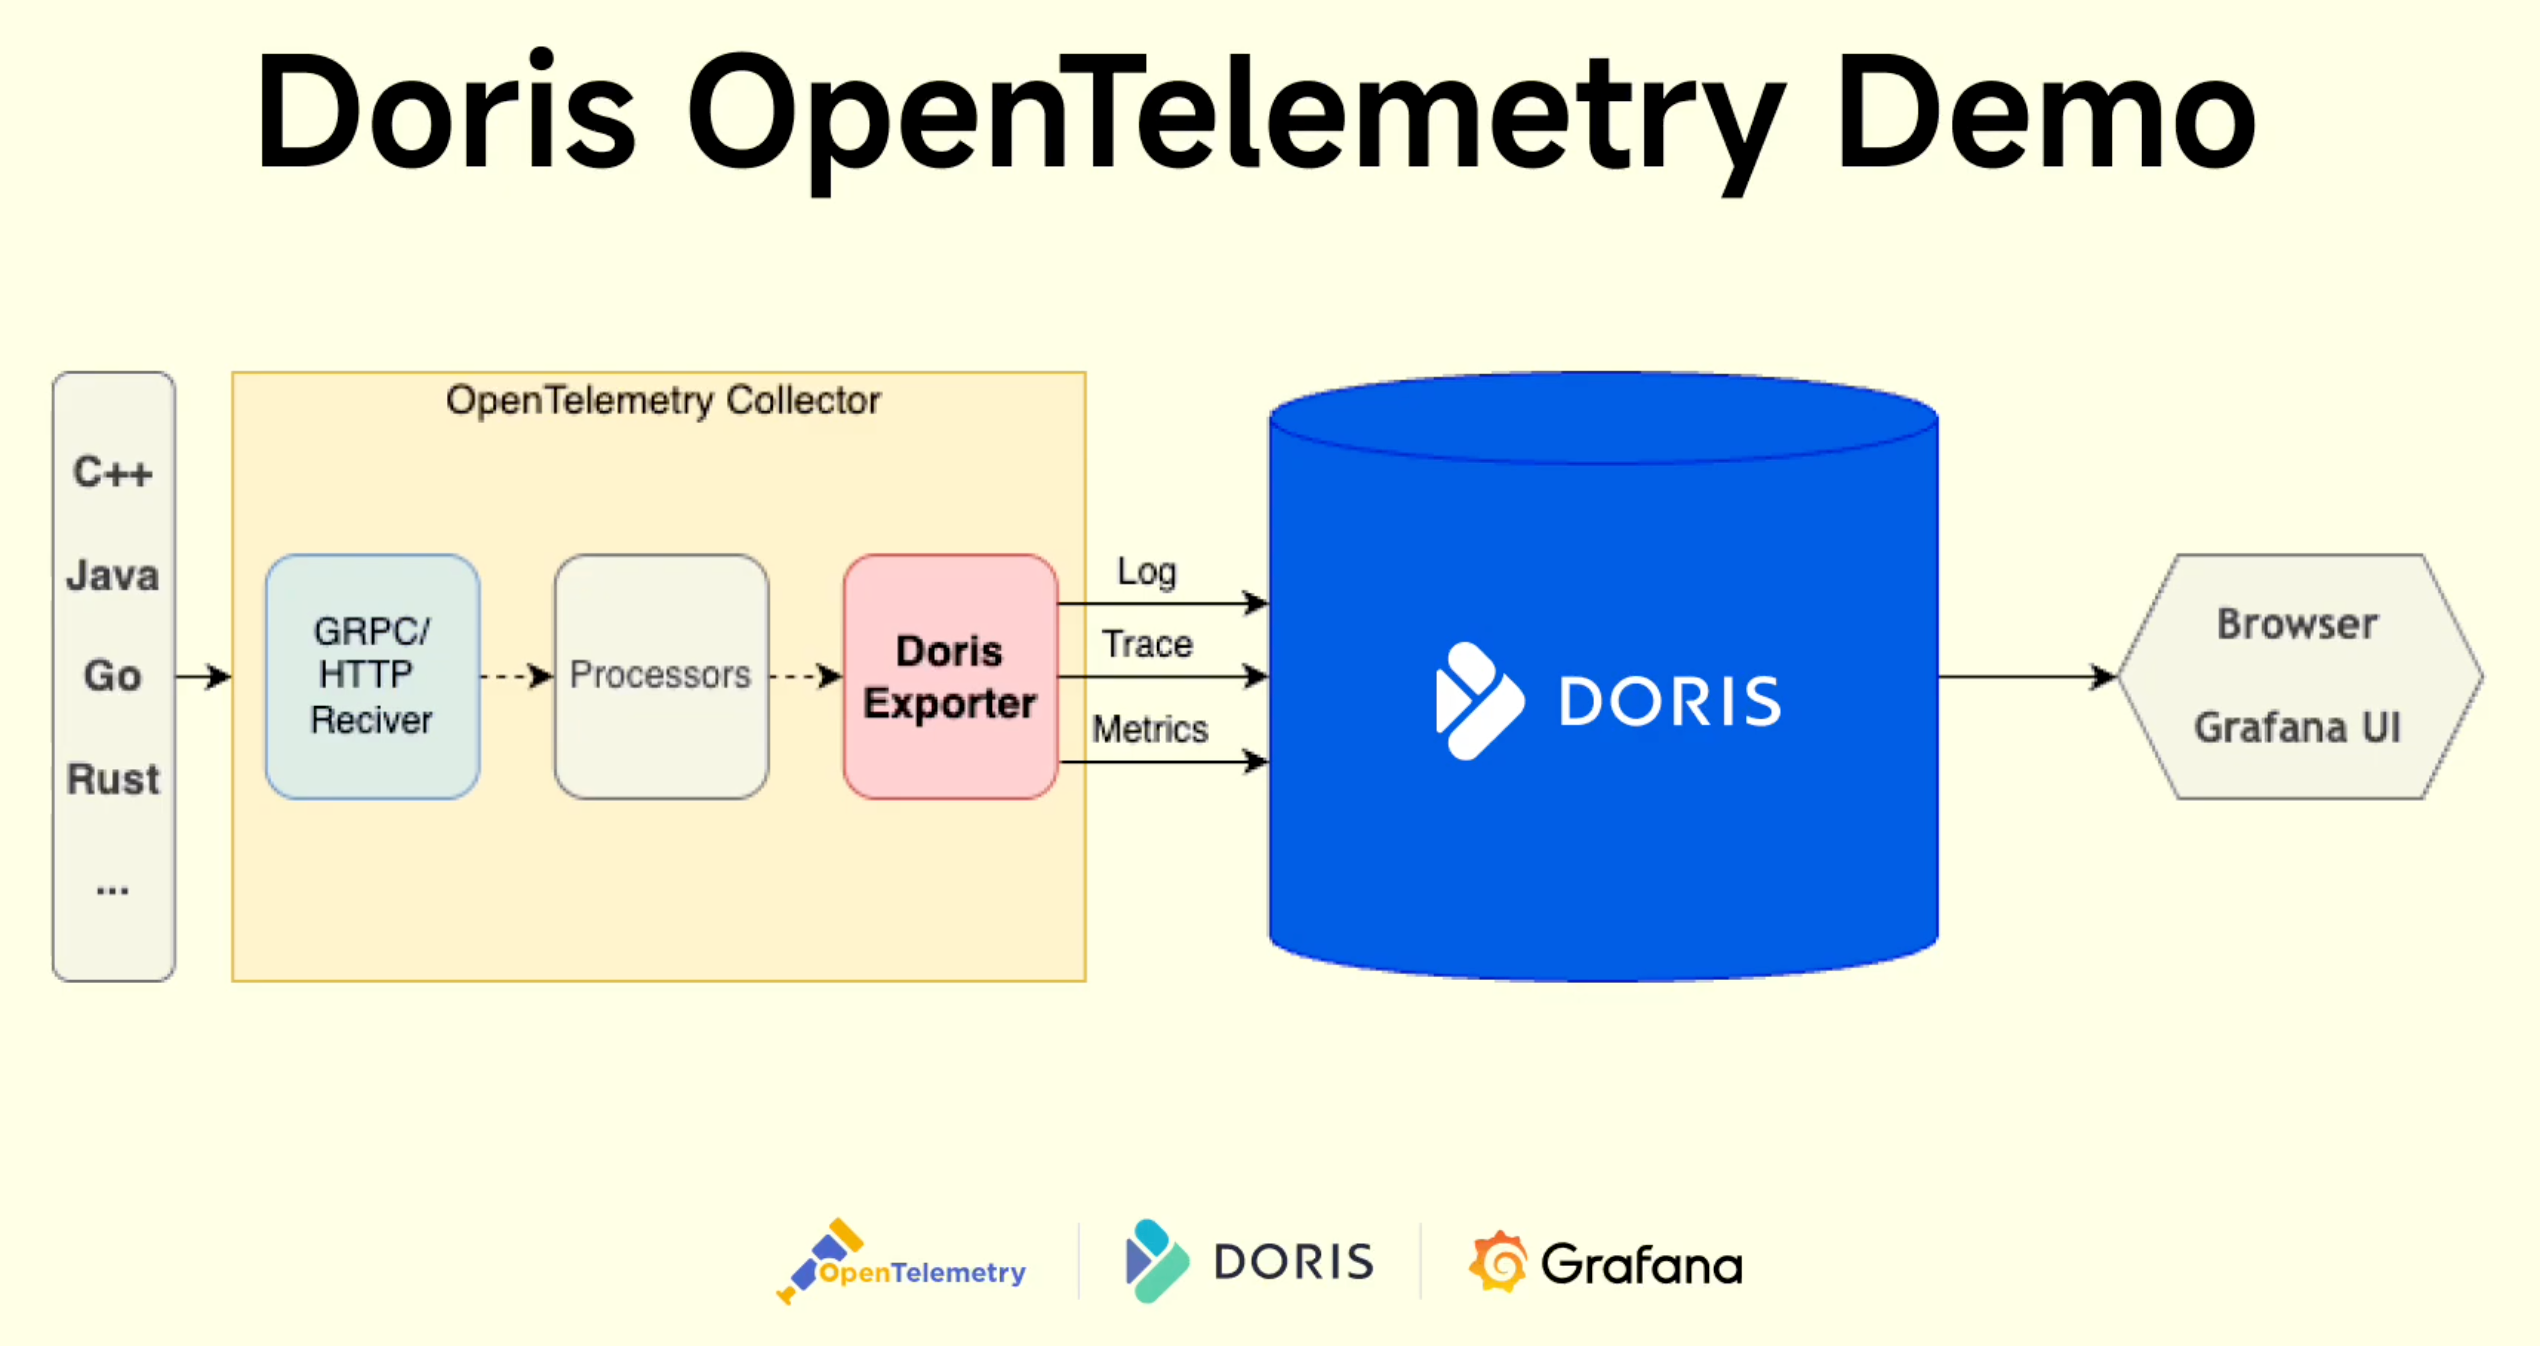 The easiest way to get started with OpenTelemetry is to try an end-to-end demo. Apache Doris provides an OpenTelemetry demo that uses Doris as the storage backend.
You can bring up the demo in just three steps:
# Step 1: Clone the demo repository
git clone https://github.com/apache/doris-opentelemetry-demo
cd doris-opentelemetry-demo

# Step 2: Start the demo with Docker Compose
docker compose up -d

# Step 3: Open Grafana in your browser
# Visit http://localhost:33000
The demo deploys an e-commerce system composed of around twenty microservices implemented in different programming languages. OpenTelemetry SDKs collect logs, traces, and metrics and send them to the OpenTelemetry Collector.
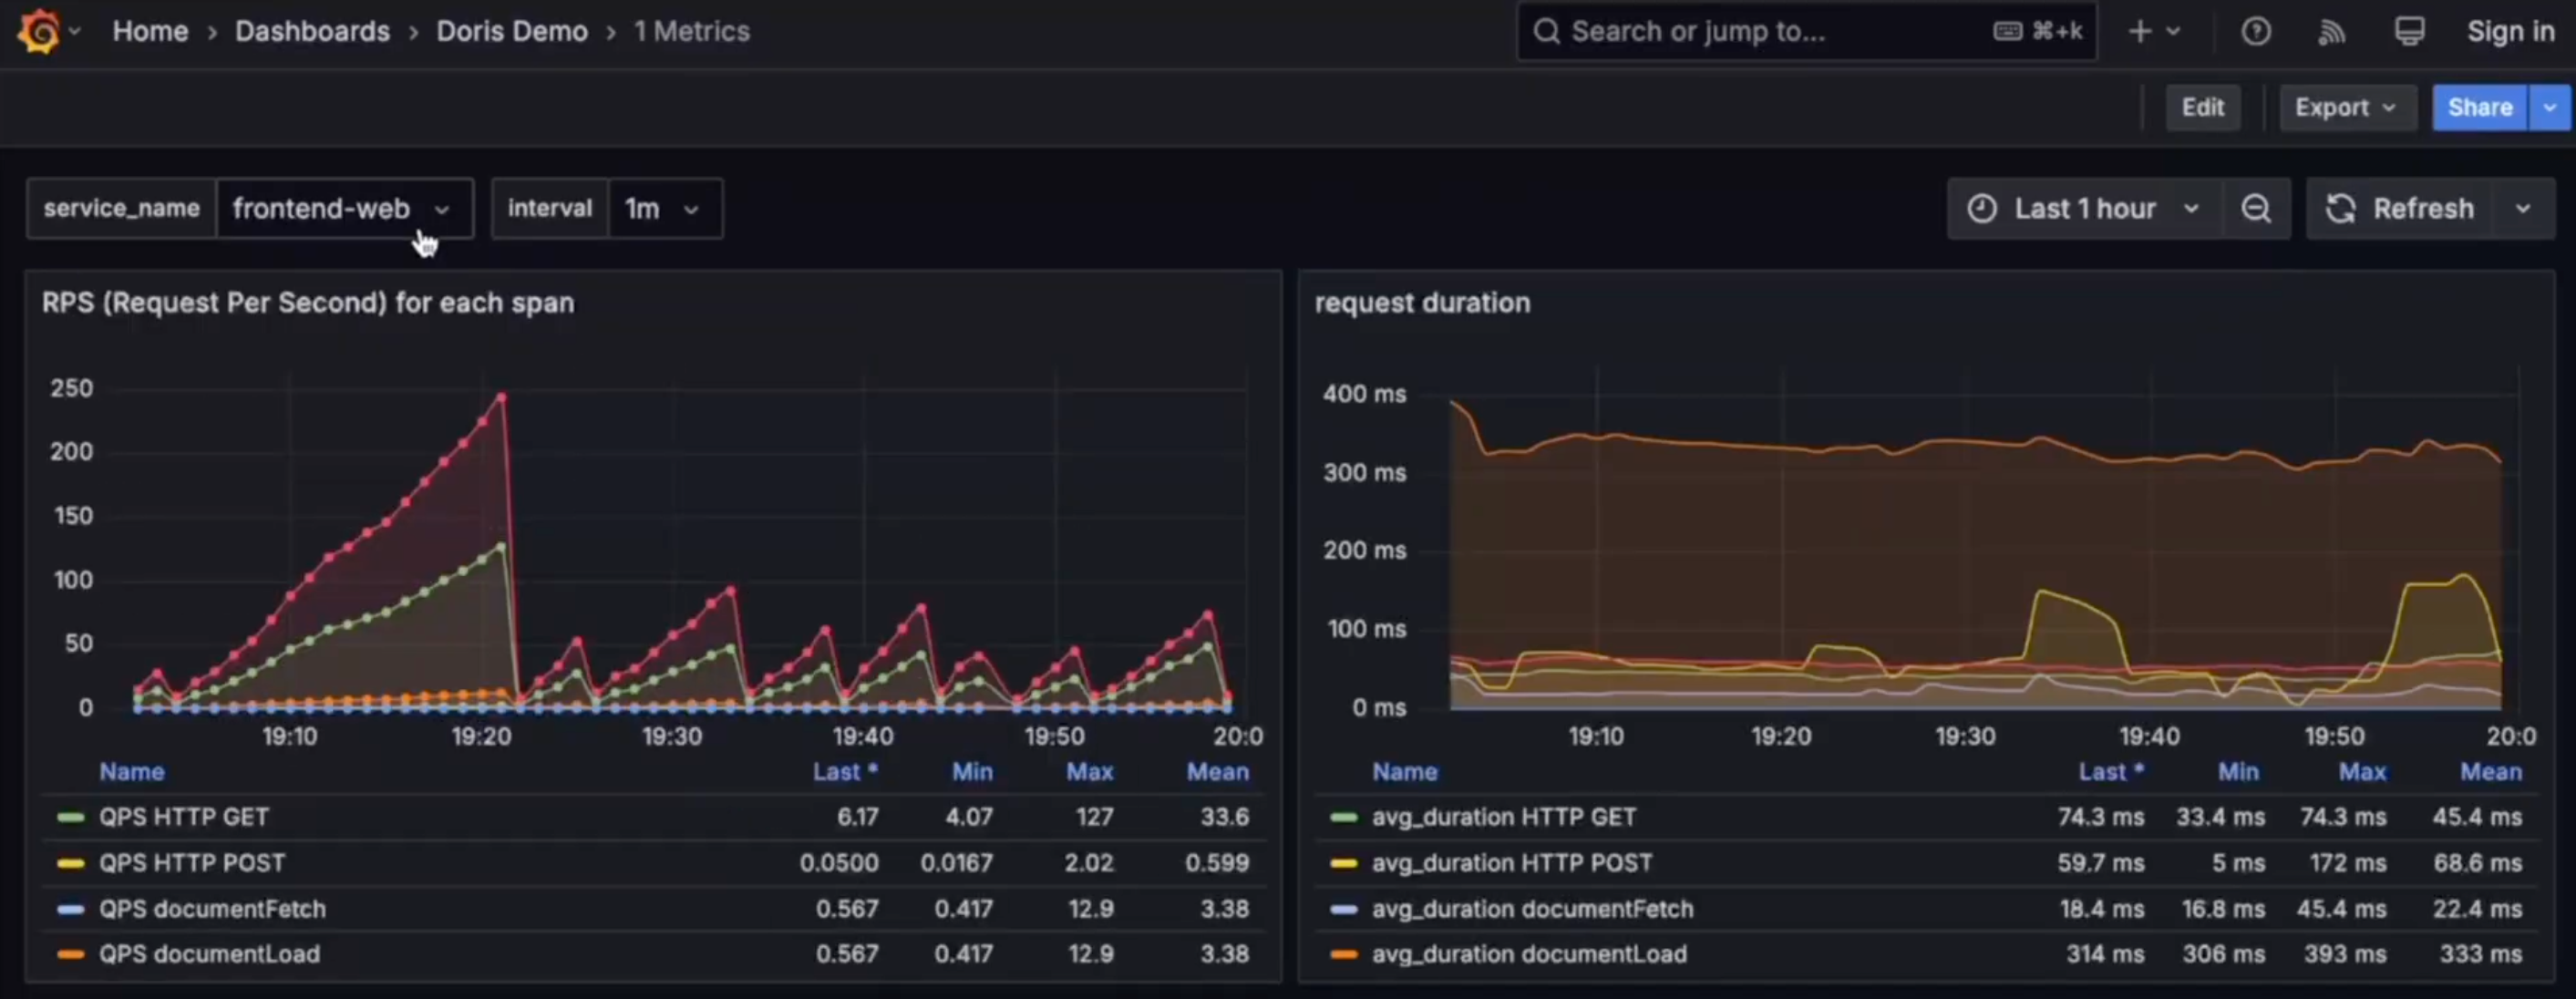
Inside the collector, the Doris Exporter writes telemetry data into Apache Doris. Grafana queries Doris using SQL and visualizes dashboards for metrics, logs, and traces. The Grafana Doris App also enables interactive exploration, providing a user experience similar to Kibana.
Limitations and Challenges of OpenTelemetry
Despite its strengths, OpenTelemetry also has some limitations.
- Not an End-to-End Solution: OpenTelemetry focuses on standards and data collection. Storage backends and visualization frontends are still required.
- Configuration Complexity: OpenTelemetry relies heavily on YAML-based configuration, which can be more complex than GUI-driven commercial tools.
- Evolving Specifications: Some areas, such as profiling and AI-powered observability, are still evolving and may change over time.
FAQ About OpenTelemetry
Q1: Is OpenTelemetry production-ready?
Yes. OpenTelemetry is widely adopted by large organizations and is supported by many production-grade observability platforms.
Q2: Does OpenTelemetry replace tools like Jaeger or Prometheus?
No. OpenTelemetry complements these tools by standardizing data collection while integrating seamlessly with existing storage and visualization systems.
Q3: Do I need to change code to use OpenTelemetry?
It depends on the programming language. For Go, .NET, Java, Python, PHP, and JavaScript, auto instrumentation often requires no code changes.
Using OpenTelemetry with VeloDB
While OpenTelemetry standardizes telemetry collection, it does not prescribe how or where data should be stored. This gives teams flexibility—but also requires choosing a backend capable of handling high-volume telemetry data efficiently.
OpenTelemetry provides built-in support for Apache Doris–compatible databases through the Doris Exporter. VeloDB is a cloud-native database built on Apache Doris and is fully compatible with it.
Using the Doris Exporter, OpenTelemetry can automatically create schemas and store telemetry data—including logs, traces, and metrics—directly in VeloDB.
You can watch a demo video at :
You can also try OpenTelemetry with VeloDB Cloud in minutes by your self for free without a credit card.
Step 1: Create a VeloDB Cloud Account
Sign up for VeloDB Cloud and create a free warehouse following the quick start guide.
Step 2: Configure the Demo for VeloDB
Clone the demo repository and update the Doris endpoint:
git clone https://github.com/apache/doris-opentelemetry-demo
cd doris-opentelemetry-demo

vim otelcol-config.yml
doris:
  endpoint: "VeloDB_http_endpoint"
  mysql_endpoint: "VeloDB_mysql_host:port"
  database: otel
  username: VeloDB_username
  password: "VeloDB_password"
  table:
    logs: otel_logs
    traces: otel_traces
    metrics: otel_metrics
  create_schema: true
Step 3: Run the Demo
docker compose up -d
Then open Grafana at http://localhost:33000 to explore your telemetry data stored in VeloDB.