


TL;DR: Database monitoring is the practice of tracking database performance, availability, and query behavior to ensure systems remain reliable and efficient. It includes monitoring metrics such as response time, query performance, resource usage, and errors, as well as analyzing logs and workload patterns. Modern database monitoring goes beyond basic metrics by helping teams diagnose performance issues, optimize queries, and maintain system stability at scale.
What Is Database Monitoring?
Database monitoring is the continuous process of tracking how a database performs, behaves, and responds to queries in production.
In practice, it focuses on making database systems more transparent by capturing how queries are executed, how resources are used, and how the system behaves under real workloads.
It typically includes:
- monitoring performance metrics such as latency, throughput, and query execution time
- tracking query behavior, including slow, frequent, and resource-intensive queries
- analyzing logs, errors, and execution patterns
- ensuring availability, uptime, and system stability
- identifying bottlenecks across queries, storage, and system resources
Unlike basic system monitoring, database monitoring goes beyond infrastructure metrics. It connects system performance with query behavior and data access patterns. As modern applications increasingly incorporate AI components, this concept is expanding further. In AI-driven systems, monitoring not only covers databases and queries, but also model behavior and inference workflows. This has led to the emergence of LLM Observability, which focuses on tracking prompt execution, response quality, latency, and token usage to better understand and control large language model performance.
This distinction is important because many database issues are not caused by hardware limits, but by how queries are written, how data is structured, and how workloads are distributed.
In modern systems, database monitoring often spans multiple layers, including:
- query execution
- indexing and storage
- caching and concurrency
- distributed nodes and replication
At its core, database monitoring is not just about detecting failures—it is about understanding how the database behaves under real usage and continuously improving performance and reliability.
Why Database Monitoring Matters
Databases are often the bottleneck of modern applications, especially in data-intensive or real-time systems.
The main reasons include:
- User experience depends on query performance: Slow queries directly translate into slow applications, making database latency one of the most critical performance factors.
- Small inefficiencies scale quickly: A query that performs well at low volume can become a major bottleneck under high concurrency or large datasets.
- Failures have immediate impact: Database issues—such as timeouts, deadlocks, or resource exhaustion—can directly affect application availability and reliability.
- Workloads are increasingly complex: Modern systems often involve distributed databases, real-time ingestion, and mixed workloads, making issues harder to detect and diagnose.
In many systems, performance problems are not caused by infrastructure limits, but by inefficient queries, missing indexes, or poorly designed data models.
This is why database monitoring is not just about tracking resource usage—it is about understanding how queries, data, and system design interact.
It helps answer questions such as:
- Why is this query slow?
- Is the issue caused by the query, the data, or the system?
- How does performance change as data grows?
- Where are the real bottlenecks in the system?
In practice, effective database monitoring allows teams to move from reactive troubleshooting to proactive performance optimization and capacity planning.
What to Monitor in Databases (Key Metrics)
When people talk about database monitoring, it’s easy to focus on a list of metrics. In practice, what matters more is how those signals connect to real performance issues.
Most problems don’t show up in a single metric—they show up as patterns. Here are the core metrics you should track:
Query Performance
If you had to pick one place to start, it’s usually query performance.
- Slow Queries: Specific SQL statements that take longer than a predefined threshold to execute.
- Execution Time: The exact duration the database engine takes to process and return data for a specific query.
- Query Frequency: How often a specific query is executed within a given timeframe.
A Practical Insight: A slow query on its own doesn’t always mean much. What really matters is how often it runs and how much load it puts on the system. A slightly inefficient query that runs thousands of times can cause more damage than a very slow query that runs once a day.
Latency and Throughput
These two metrics define the overall speed and capacity of your database and usually move together.
- Response Time (Latency): The total round-trip time it takes for the database to return results to the application.
- Throughput (Queries Per Second / QPS): The volume of work or number of queries the database handles at any given moment.
A Practical Insight: As traffic increases, throughput goes up—but at some point, latency starts to rise as well. That’s often the first sign that the system is reaching its limits. Understanding where that tipping point is tends to be more useful than looking at either metric in isolation.
Resource Usage
Resource metrics are helpful, but they’re easy to misinterpret.
- CPU Utilization: Indicates the processing power consumed by query parsing, execution, and sorting.
- Memory Usage (Buffer/Cache): Tracks how much data is held in RAM for fast access versus how much is swapped to disk.
- Disk I/O : Measures the speed and volume of read/write operations to physical storage (a common bottleneck).
A Practical Insight: High CPU or I/O doesn’t necessarily mean something is wrong. In many cases, it just means the database is doing work. The real question is whether that work is efficient—or whether it’s caused by things like full table scans, missing indexes, or poorly structured queries.
Connections and Concurrency
Concurrency is where a lot of real-world problems start to show up.
- Active Connections: The number of client applications or microservices currently connected to and interacting with the database.
- Connection Limits (Saturation): How close the database is to its maximum allowed concurrent connections. Hitting this limit causes immediate application failures.
A Practical Insight: A system can perform well under light load but degrade quickly when too many queries compete for the same resources. In these cases, the issue isn’t a single query—it’s how multiple queries interact.
Errors, Failures, and Edge Cases
Failures are often the clearest signal that something is off, but they don’t always tell you why.
- Failed Queries: Queries that return errors due to syntax issues, permission denials, or aborted transactions.
- Timeouts: Queries that are forcefully terminated because they exceeded the maximum allowed execution time.
- Deadlocks: Situations where two or more transactions block each other indefinitely while waiting for locks to release.
A Practical Insight: A timeout might be caused by a slow query, high concurrency, or resource saturation. Deadlocks often point to deeper issues in how data is accessed or updated. They’re useful signals—but they need context.
Logs and Events
Metrics can tell you that something is wrong, but logs help you see what actually happened.
- Slow Query Logs: Detailed records of individual queries that exceeded performance thresholds, including their execution plans.
- System Logs: Engine-level logs recording database restarts, configuration changes, or fatal errors.
A Practical Insight: Looking at logs is usually where things become clear—what query ran, how long it took, and what the system was doing at the time.
The Ultimate Takeaway
Most database issues don’t come from a single metric going wrong. They show up as combinations, like:
- Slow queries alongside high CPU
- Rising latency under increasing concurrency
- Timeouts during peak traffic
That’s why effective monitoring is less about collecting more metrics, and more about understanding how they fit together.
How Database Monitoring Works
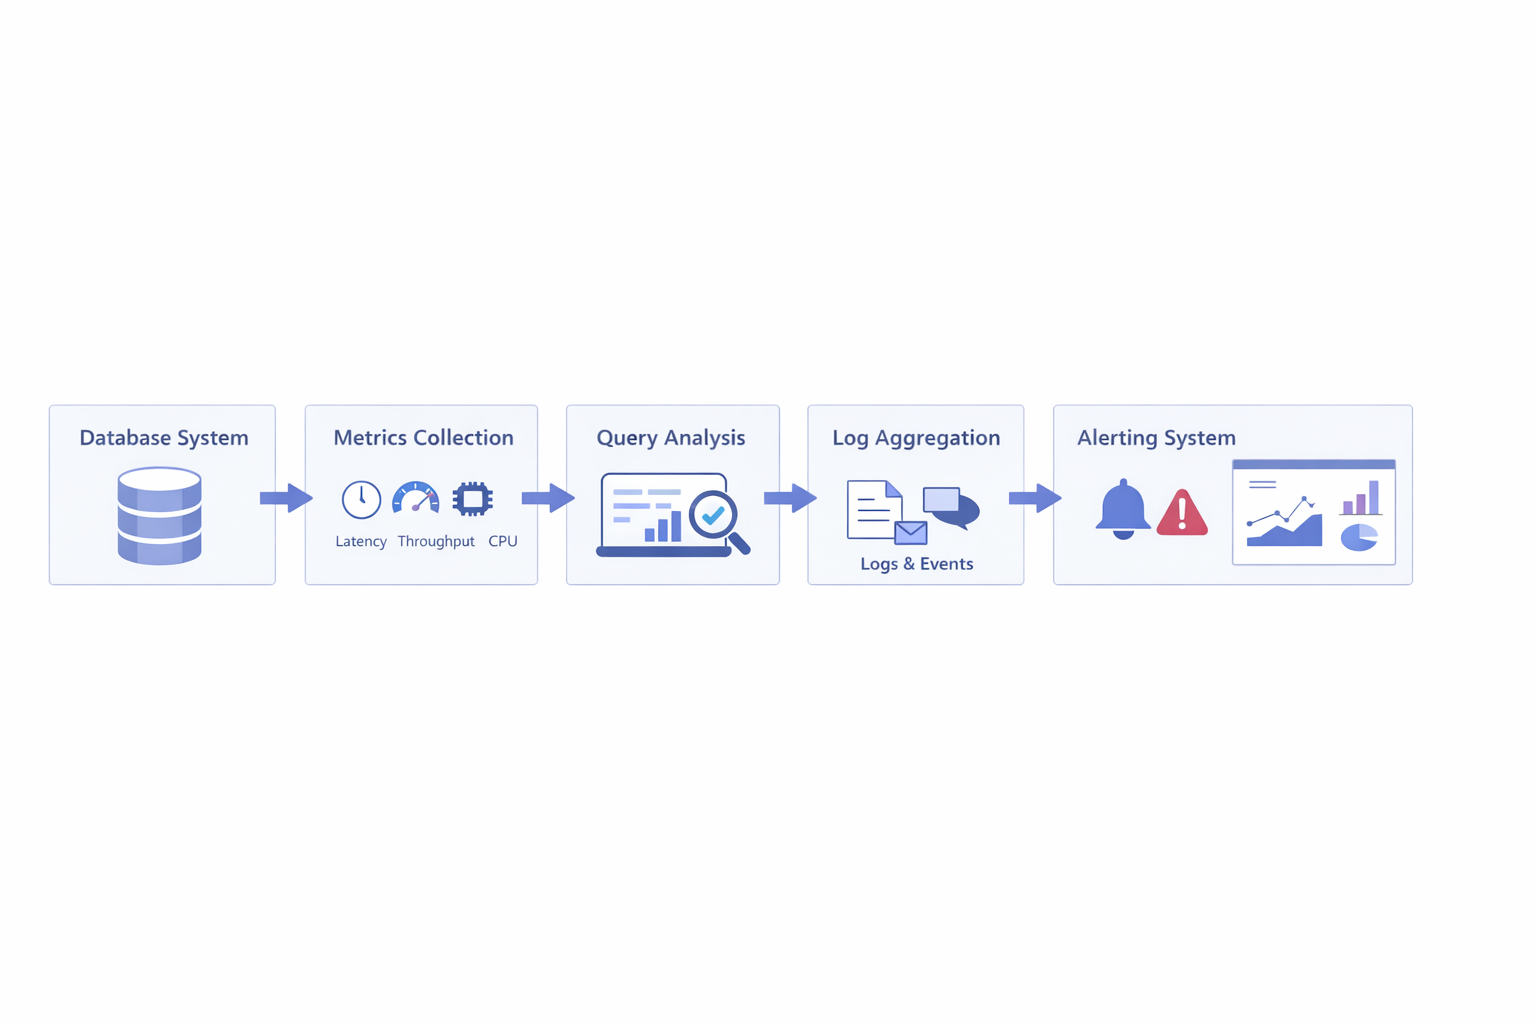 Database monitoring typically involves several steps:
- collecting metrics from the database
- analyzing query performance
- aggregating logs and events
- triggering alerts when thresholds are exceeded
In modern systems, monitoring is often combined with tracing and observability tools to provide deeper insight into query behavior and system interactions.
For example, in real-time analytics or observability workloads, monitoring may involve analyzing large volumes of logs, events, and high-cardinality data in near real time. In these scenarios, the database itself becomes part of the monitoring system.
Platforms such as VeloDB, which are designed for real-time analytical workloads, are often used to query and analyze monitoring data at scale, especially when dealing with logs, metrics, and event streams.
Types of Database Monitoring
When people talk about database monitoring, they often split it into a few categories. That’s useful for understanding the landscape—but in real systems, these boundaries are rarely that clear.
Most issues don’t fit neatly into just one type.
Performance Monitoring
This is usually where people start.
It focuses on things like query latency, throughput, and execution time—basically, how fast the database responds under load.
In practice, performance monitoring is often the first signal that something is wrong. A sudden spike in latency or a drop in throughput is usually what triggers deeper investigation.
Availability Monitoring
Availability is about whether the database is actually up and usable.
This includes uptime, failed requests, and connection errors. Compared to performance issues, availability problems are more obvious—but also more disruptive.
When availability drops, the impact is immediate. But what’s less obvious is that many availability issues are actually caused by underlying performance or resource problems.
Log Monitoring
Logs are where things start to make sense.
While metrics can tell you that latency is increasing, logs can show you which queries are causing it, what parameters were used, and what the system was doing at that moment.
In many cases, debugging without logs is almost impossible—especially when dealing with intermittent or hard-to-reproduce issues.
Security Monitoring
Security monitoring focuses on access patterns, anomalies, and unexpected behavior.
This might include unusual query patterns, unauthorized access attempts, or sudden spikes in activity.
It’s often treated as a separate concern, but in practice, it overlaps with performance and log monitoring. For example, an unexpected workload spike might be either a legitimate traffic surge—or a potential security issue.
A Practical Perspective
In real-world systems, these categories are not independent.
A single issue might show up as:
- increased latency (performance)
- connection failures (availability)
- unusual query patterns (logs or security)
That’s why database monitoring is usually less about choosing a category, and more about connecting signals across different layers.
Common Challenges in Database Monitoring
On paper, database monitoring sounds straightforward: collect metrics, set alerts, and react when something goes wrong.
In practice, it’s rarely that simple.
Too Many Metrics
Modern databases expose a huge number of metrics.
The challenge is not collecting them—it’s figuring out which ones actually matter. It’s easy to track everything and still miss the real issue, especially if the signals you’re watching aren’t directly tied to user impact.
Noisy Alerts
Alerting tends to become a problem over time.
If thresholds are too sensitive, you get constant alerts that don’t require action. If they’re too loose, real issues go unnoticed.
Either way, teams can end up ignoring alerts altogether, which defeats the purpose of monitoring.
Distributed System Complexity
In distributed systems, problems rarely have a single source.
A slowdown might be caused by:
- a specific node
- uneven data distribution
- network latency
- or interactions between multiple services
This makes it harder to trace issues back to a clear root cause.
Query-Level Debugging
Many real performance issues come down to individual queries—but understanding them isn’t always easy.
It often requires looking at execution plans, data distribution, indexing strategies, and how queries behave under load. And even then, the issue may only appear under specific conditions.
The Real Challenge
In the end, the hardest part of database monitoring is not collecting data—it’s making sense of it.
Most systems already have enough signals. The difficulty is knowing which ones to trust, how they relate to each other, and what action to take.
Database Monitoring Tools (And How to Choose)
There’s no single “best” database monitoring tool—what works depends heavily on how your system is built and what kind of problems you’re trying to solve.
In practice, database monitoring tools fall into four main categories:
Built-in Database Tools
Most databases come with native monitoring capabilities.
Common examples include:
- PostgreSQL:
pg_stat_statementsfor query tracking - MySQL: Performance Schema for resource and query analysis
- Oracle: AWR (Automatic Workload Repository) and ASH (Active Session History) for performance diagnostics
These tools provide direct visibility into query execution and internal behavior.
Built-in tools are best suited for:
- debugging slow or inefficient queries
- analyzing execution plans and indexes
- understanding database-level performance
They are often the first step, but they are limited to a single database and don’t provide system-wide visibility.
Monitoring Platforms
Monitoring platforms focus on collecting and visualizing metrics across systems.
Common examples include:
- Prometheus: metrics collection and alerting
- Datadog: full-stack monitoring platform
- Zabbix: infrastructure and database monitoring
These tools help teams understand how the database behaves within the broader system.
Monitoring platforms are typically used to:
- track latency, throughput, and errors
- monitor infrastructure and database metrics together
- trigger alerts when thresholds are exceeded
However, they are generally better at showing what is happening than explaining why.
Observability Tools
Observability tools combine metrics, logs, and traces to provide deeper insight.
Common examples include:
- Grafana: visualization and dashboards
- Elastic (ELK Stack): log storage and search
- OpenTelemetry: telemetry collection framework
These tools make it easier to correlate database activity with application behavior.
Observability tools help teams:
- trace requests across services
- correlate logs, metrics, and query activity
- diagnose distributed or complex issues
In modern distributed systems, this level of visibility is often essential.
Analytical Databases for Monitoring Workloads
In large-scale systems, monitoring data itself becomes a data problem.
Logs, metrics, and events can reach massive volumes and require fast querying for real-time analysis.
Common examples include:
- ClickHouse: high-performance analytical database
- VeloDB: real-time analytics database for observability workloads
These systems are often used as the backend for observability platforms, where they store and analyze telemetry data at scale.
Analytical databases are typically used for:
- querying large volumes of logs and metrics
- handling high-cardinality data
- enabling real-time investigation and ad-hoc analysis
How to Choose in Practice
Choosing a tool is less about feature lists and more about context.
The right approach depends on:
- system complexity (single instance vs distributed architecture)
- workload type (transactional, analytical, real-time)
- data scale and query volume
- need for real-time vs historical analysis
- operational cost and maintenance overhead
In most production environments, a single tool is rarely enough. Teams typically combine multiple approaches—for example:
- built-in tools for query debugging
- monitoring platforms for system metrics
- observability tools for tracing and logs
- analytical databases for large-scale data analysis
Best Practices for Database Monitoring
There are plenty of metrics you can track, but effective monitoring is less about coverage and more about focus.
What tends to matter most is how you use the data, not how much of it you collect.
Start with Query Performance
If something feels slow, it’s usually a query problem first.
Focusing on query performance early—especially slow or frequently executed queries—often leads to the fastest improvements.
Establish a Baseline
It’s hard to detect issues if you don’t know what “normal” looks like.
Understanding typical latency, throughput, and resource usage makes it much easier to spot anomalies when they appear.
Be Careful with Alerts
Alerting sounds simple, but it’s easy to get wrong.
Too many alerts, and people start ignoring them. Too few, and real issues slip through. The goal is to make alerts actionable—not just visible.
Look at Trends, Not Just Spikes
Short-term spikes can be misleading.
What usually matters more are patterns over time—gradual increases in latency, growing resource usage, or changing query behavior. These trends often reveal issues before they become critical.
Combine Metrics with Context
Metrics tell you that something is wrong, but not why.
That’s where logs and query details come in. Looking at them together is usually the fastest way to understand what’s actually happening.
A Practical Perspective
Good monitoring doesn’t come from tracking everything.
It comes from focusing on the signals that directly affect performance and reliability—and knowing how to interpret them.
Database Monitoring vs Observability
| Aspect | Monitoring | Observability |
|---|---|---|
| Focus | Tracking system metrics and alerts | Understanding system behavior |
| Data Used | Metrics (CPU, latency, errors) | Metrics, logs, and traces |
| Purpose | Detect issues | Diagnose and explain issues |
| Approach | Predefined thresholds and dashboards | Exploratory analysis and debugging |
| Typical Question | “Is the system healthy?” | “Why is the system behaving this way?” |
People often use “monitoring” and “observability” interchangeably, but in practice, they solve slightly different problems.
A simple way to think about it is:
- monitoring tells you something is wrong
- observability helps you understand why
How They Work Together
In real systems, monitoring usually comes first.
You might notice something like:
- latency increasing
- error rates going up
That’s the signal.
Observability is what you use next—to dig deeper:
- which queries are causing the issue
- whether it’s related to data, indexing, or concurrency
- how the problem evolves over time
In that sense, monitoring and observability are not competing approaches. They’re part of the same workflow.
Most teams start with monitoring, but as systems grow more complex—especially with distributed or real-time workloads—observability becomes increasingly important.
The Future of Database Monitoring
Database monitoring is changing as systems become more distributed, data-heavy, and real-time.
What used to be a relatively contained problem—tracking a single database—now often involves multiple services, pipelines, and data flows.
Real-Time and Streaming Workloads
More systems now operate on continuous data streams rather than static datasets.
This makes monitoring more time-sensitive. Instead of analyzing issues after they happen, teams increasingly need to detect and respond to problems as they occur.
Distributed and Cloud-Native Systems
Modern architectures are rarely centralized.
Data is often spread across regions, nodes, or services, which makes it harder to pinpoint where issues originate. Monitoring in these environments is less about a single database and more about understanding interactions across the system.
Convergence with Observability
The line between monitoring and observability is getting less clear.
Many teams are moving toward a unified approach where metrics, logs, and traces are analyzed together, rather than using separate tools for each.
AI-Assisted Analysis
As systems generate more data, manually interpreting signals becomes harder.
There is growing interest in using AI to:
- detect anomalies
- identify performance patterns
- suggest optimizations
While still evolving, this trend points toward more automated ways of understanding system behavior.
A Practical Perspective
Database monitoring is gradually shifting from:
tracking individual metrics to: understanding system behavior as a whole
As systems grow more complex, the challenge is no longer collecting data—it’s making sense of it in a way that leads to better decisions.
Conclusion
At a glance, database monitoring may seem like a matter of tracking metrics and setting alerts. In practice, it’s more about understanding how queries, data, and system behavior interact over time.
As systems become more distributed and data-intensive, the challenge is no longer just collecting signals—it’s being able to analyze them at scale and turn them into actionable insight.
This is why, in many modern architectures, the database itself becomes part of the monitoring system. Instead of treating monitoring data as something separate, teams increasingly rely on analytical systems to query logs, metrics, and events in real time.
Platforms like VeloDB, for example, are often used in this context to support large-scale analysis of observability data—helping teams explore query patterns, diagnose performance issues, and understand system behavior more effectively.
Ultimately, effective database monitoring is not about having more tools or more metrics. It’s about being able to see what’s happening, understand why it’s happening, and respond with confidence.