Customer-facing analytics has become the defining feature that separates sticky SaaS products from commoditized tools. When Stripe shows merchants their revenue trends, when Shopify surfaces store performance metrics, when Datadog displays usage patterns, they're not just providing data. They're creating reasons for customers to log in daily, to stay subscribed, and to expand their usage.
This guide explores what customer-facing analytics means, why it matters for modern businesses, and the technical architecture required to deliver analytics experiences that match user expectations.
What Is Customer-Facing Analytics?
Before diving into implementation details, let's establish a clear understanding of what customer-facing analytics means and why it has become a critical product capability.
Definition of Customer-Facing Analytics
Customer-facing analytics refers to data visualization and reporting capabilities embedded directly into products that end users interact with. Unlike internal business intelligence tools used by analysts and executives, customer-facing analytics puts data insights in the hands of the people who generated that data: your customers.
A logistics platform showing delivery drivers their performance stats. A financial app displaying spending patterns to account holders. An e-commerce dashboard revealing sales trends to merchants. These are all examples of customer-facing analytics in action.
The key distinction is the audience. Traditional BI serves internal stakeholders who need company-wide insights. Customer-facing analytics serves external users who need insights about their own slice of data within your platform.
Why Customer-Facing Analytics Matters Today
Three market forces have made customer-facing analytics essential rather than optional.
First, user expectations have shifted. Consumers now expect the same data visibility in B2B products that they get from consumer apps. If their fitness tracker shows daily activity trends, why shouldn't their CRM show sales pipeline trends? The bar for acceptable user experience has risen across all software categories.
Second, analytics drives retention. Products with embedded analytics see measurably higher engagement. When users can answer their own questions within your product, they have less reason to export data elsewhere or seek alternatives. The data becomes a moat.
Third, analytics creates revenue opportunities. Many SaaS companies now offer analytics as a premium tier feature or charge based on dashboard access. Stripe's advanced reporting, Shopify's detailed store analytics, and Datadog's custom dashboards all represent monetized analytics capabilities.
Customer-Facing Analytics vs Traditional BI
 Understanding what customer-facing analytics is requires understanding what it is not.
Customer-Facing Analytics vs Business Intelligence
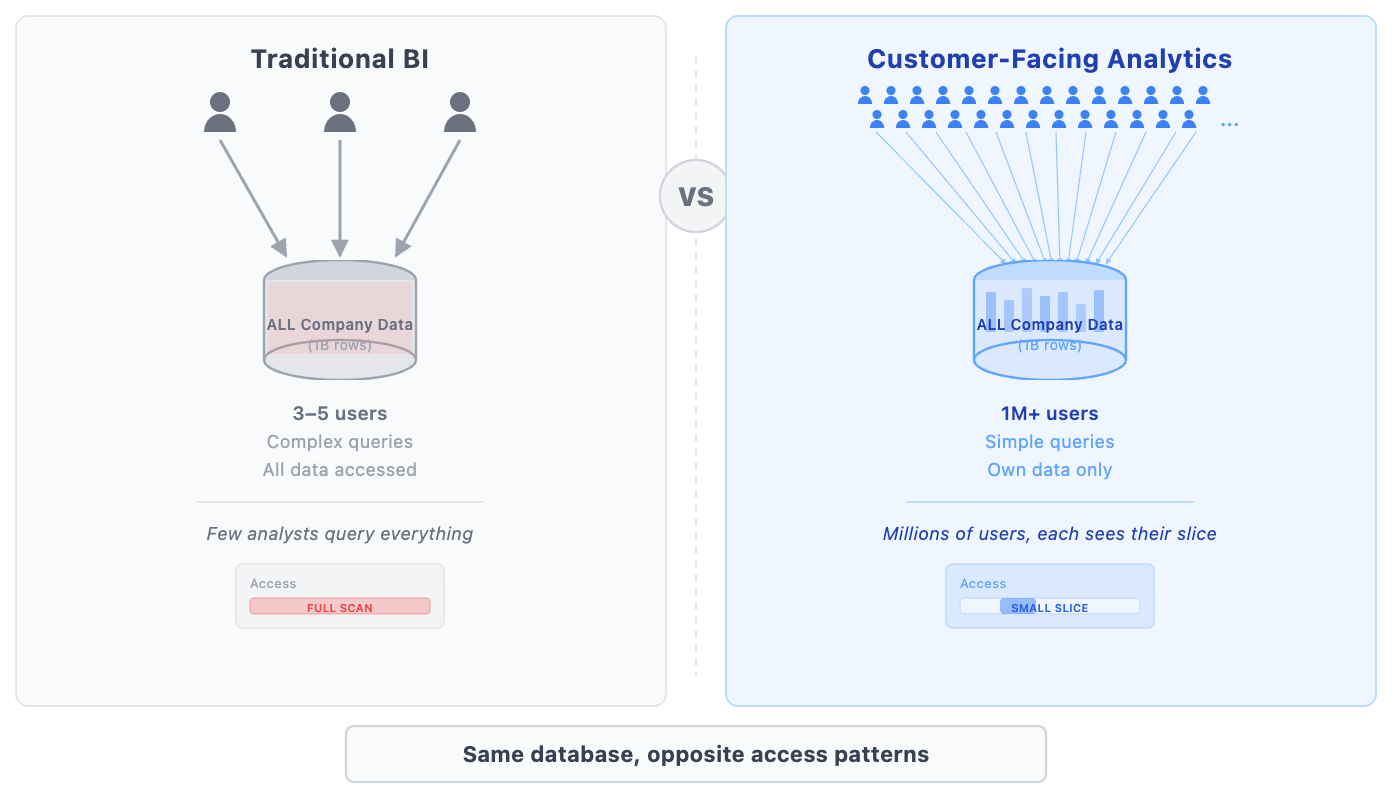
Business intelligence tools like Tableau, Looker, and Power BI serve internal teams analyzing company-wide data. An analyst might query total revenue across all customers, segment performance by region, or build executive dashboards summarizing business health.
Customer-facing analytics inverts this model. Instead of few users querying all data, you have many users each querying their own data. A Shopify merchant doesn't see every store's sales; they see only their store's sales. A Stripe user doesn't see all transactions; they see only their transactions.
This inversion creates fundamentally different technical requirements. BI tools optimize for complex analytical queries run by dozens of analysts. Customer-facing analytics must optimize for simpler queries run by millions of users simultaneously.
Customer-Facing Analytics vs Embedded Analytics
Embedded analytics typically refers to taking a BI tool and embedding it within another application via iframes or APIs. Tools like Looker, Metabase, and Sisense offer embedding capabilities.
Customer-facing analytics is a broader concept. Embedding is one implementation approach, but customer-facing analytics can also be built natively within applications using purpose-built analytics databases. The distinction matters because embedded BI tools weren't designed for the concurrency and latency requirements of serving millions of end users.
Customer-Facing Analytics vs User-Facing Analytics
These terms are often used interchangeably. User-facing analytics is slightly broader, encompassing any analytics shown to users whether they're paying customers or internal employees. Customer-facing analytics specifically targets external customers using your product.
For practical purposes, the technical challenges are identical. Whether you're showing dashboards to millions of customers or thousands of employees, you need the same infrastructure: high concurrency, low latency, and efficient data isolation.
Why Businesses Need Customer-Facing Analytics
The business case for customer-facing analytics extends beyond feature checklists. It touches customer expectations, operational efficiency, and revenue growth in concrete ways.
Meeting Modern Customer Expectations
Users now expect to see their data. A decade ago, requesting a report from a vendor seemed reasonable. Today, it signals a product gap. When Uber shows ride history instantly, when Robinhood displays portfolio performance in real-time, when Notion surfaces document analytics automatically, these experiences set the expectation baseline.
B2B buyers increasingly apply consumer standards to enterprise software. They want immediate answers, not scheduled reports. They want interactive exploration, not static PDFs. Products that fail to meet these expectations lose deals to competitors who do.
Building Trust Through Transparency
Analytics creates accountability. When customers can see exactly what happened with their data, trust increases. A payment processor that shows detailed transaction logs builds more confidence than one that provides only monthly summaries. A logistics company that surfaces real-time delivery tracking earns more trust than one that updates once daily.
Transparency through analytics also reduces disputes. When both parties see the same data, disagreements about what happened become less common. The shared visibility creates alignment.
Reducing Customer Support and Feature Requests
Every question a customer can answer themselves is a support ticket avoided. Analytics capabilities dramatically reduce "what happened to my X" inquiries. Instead of asking support for last month's usage data, users pull it themselves. Instead of requesting custom reports, users build their own views.
This reduction scales with customer base. Companies with millions of users cannot provide human support for routine data questions. Self-service analytics is the only viable approach.
Driving Retention, Expansion, and Revenue
Analytics drives three business outcomes directly.
Retention improves because engaged users who regularly check dashboards develop habits around your product. The data becomes part of their workflow, making switching costly.
Expansion occurs when analytics reveals opportunities. A user seeing rising engagement metrics is primed to upgrade for more capacity. A merchant noticing sales trends may invest in advertising tools you offer.
Revenue comes from analytics as a premium feature. Many SaaS products gate advanced analytics behind higher-tier plans, creating clear upgrade paths for data-hungry customers.
Core Features of Customer-Facing Analytics
Effective customer-facing analytics shares a common set of capabilities regardless of industry or use case. These features define what users expect from modern analytics experiences.
Interactive Dashboards and Visualizations
Static charts are table stakes. Modern customer-facing analytics requires interactive elements: drill-downs to explore anomalies, filters to segment data, time range selections to compare periods, and hover states to reveal details.
Interactivity transforms analytics from "reporting" to "exploration." Users discover insights rather than simply viewing them. This exploration drives engagement and helps users extract value from their data.
Self-Service Analytics for End Users
The highest-value customer-facing analytics enables users to ask questions that product designers didn't anticipate. Self-service features might include custom report builders, ad-hoc query interfaces, or configurable dashboard layouts.
Self-service capabilities must balance power with simplicity. Overwhelming users with complexity defeats the purpose. The best implementations offer progressive disclosure: simple views by default with advanced options available for power users.
Personalization and White-Labeling
For platforms serving diverse customer segments, personalization ensures relevant analytics for each user type. A small merchant needs different metrics than an enterprise retailer. A startup founder needs different views than a financial controller.
White-labeling extends this customization to branding. Many B2B products offer analytics that customers can present to their own clients, requiring removal of vendor branding and replacement with customer logos and colors.
Real-Time Data Access
Batch-updated dashboards increasingly feel outdated. Users expect data freshness measured in seconds, not hours. When a transaction completes, users expect to see it reflected immediately. When a delivery status changes, the dashboard should update instantly.
Real-time analytics requires more than fast databases. The entire pipeline from data generation to visualization must support low-latency updates. This architectural requirement influences technology choices throughout the stack.
Multi-Tenant Data Architecture
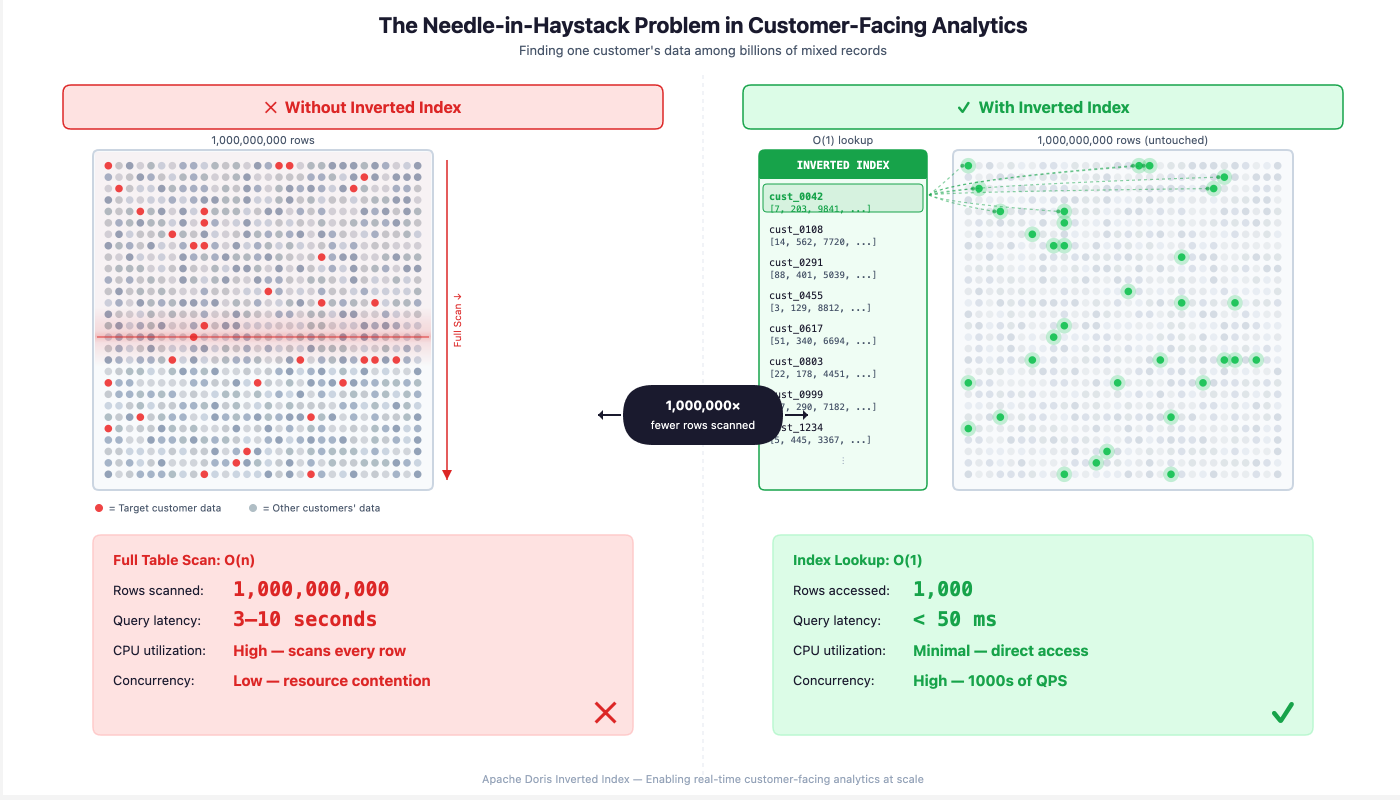
Customer-facing analytics inherently involves multi-tenancy: many customers sharing infrastructure while seeing only their own data. This creates the "needle-in-haystack" problem central to the technical challenge.
Your platform stores data from all customers in shared tables. Each customer queries only their own subset. Finding one customer's records among billions must happen in milliseconds. This requirement shapes database selection more than any other factor.
Security, Access Control, and Governance
Analytics access must be carefully controlled. Row-level security ensures users see only permitted data. Role-based access controls determine which features different user types can access. Audit logging tracks who viewed what data and when.
Compliance requirements add further constraints. Healthcare analytics must satisfy HIPAA. Financial analytics must address SOC 2 and PCI-DSS. European users require GDPR-compliant data handling. These requirements cannot be afterthoughts.
Common Use Cases of Customer-Facing Analytics
Customer-facing analytics appears across industries, though the specific metrics and visualizations vary by domain. The following examples illustrate how different sectors implement analytics for their users.
SaaS and B2B Platforms
Stripe provides merchant dashboards showing transaction volumes, success rates, dispute trends, and revenue analytics. Merchants can drill into individual transactions, export data for reconciliation, and set up alerts for anomalies.
Datadog surfaces usage analytics showing which features customers consume, helping them optimize their monitoring setup and understand billing. Usage visibility reduces billing surprises and helps customers rightsize their plans.
Shopify offers store analytics covering traffic sources, conversion rates, product performance, and customer behavior. Merchants use these insights to adjust inventory, optimize marketing, and improve store design.
Financial Services and Fintech
Banking apps display spending categorization, budget tracking, and financial health scores. Investment platforms show portfolio performance, allocation breakdowns, and historical returns. Credit services surface score factors and improvement recommendations.
These analytics transform commoditized financial products into differentiated experiences. When the underlying service (transferring money, buying stocks) is identical across providers, the analytics layer becomes the differentiator.
Healthcare and Telemedicine
Patient portals display health metrics over time, medication adherence, appointment history, and test results with trend analysis. Wearable integrations surface activity, sleep, and vital sign patterns.
Healthcare analytics must balance comprehensiveness with clarity. Overwhelming patients with data they can't interpret serves no one. Effective healthcare analytics highlights actionable insights while providing detailed data for those who want it.
Education and EdTech
Learning platforms show progress through curricula, time spent on topics, assessment performance, and skill mastery. Instructors see class-wide analytics identifying struggling students and difficult concepts.
Education analytics closes feedback loops that traditional schooling left open. Students see exactly where they stand. Teachers identify problems before they compound. Parents track progress without waiting for report cards.
Logistics and Operations
Shipping platforms display package tracking, delivery success rates, exception handling, and historical performance. Fleet management systems surface vehicle utilization, route efficiency, and driver performance.
Logistics analytics serves both operational and commercial purposes. Operationally, it helps identify problems and optimize performance. Commercially, it justifies premium pricing by demonstrating value delivered.
Enterprise Internal Analytics: The Same Pattern
The same technical requirements apply when serving internal enterprise users at scale.
Operations dashboards refresh constantly as thousands of employees monitor business metrics. Each department sees their relevant slice: sales sees pipeline, support sees ticket volumes, finance sees cash flow.
Logistics station consoles let workers check package states, sorting stats, and shift performance. Hundreds of stations across dozens of facilities query simultaneously during peak hours.
Field sales tools give representatives CRM data filtered to their territory. Regional managers see rollups. Executives see company-wide views. All queries must respond instantly regardless of scope.
The pattern is consistent: high concurrency, needle-in-haystack filtering, and real-time freshness. Whether serving customers or employees, the database requirements are identical.
Architecture Options for Customer-Facing Analytics
 Choosing the right architecture for customer-facing analytics involves trade-offs between simplicity, performance, and cost. Three primary approaches dominate the landscape, each suited to different stages of product maturity.
Using the Application Database
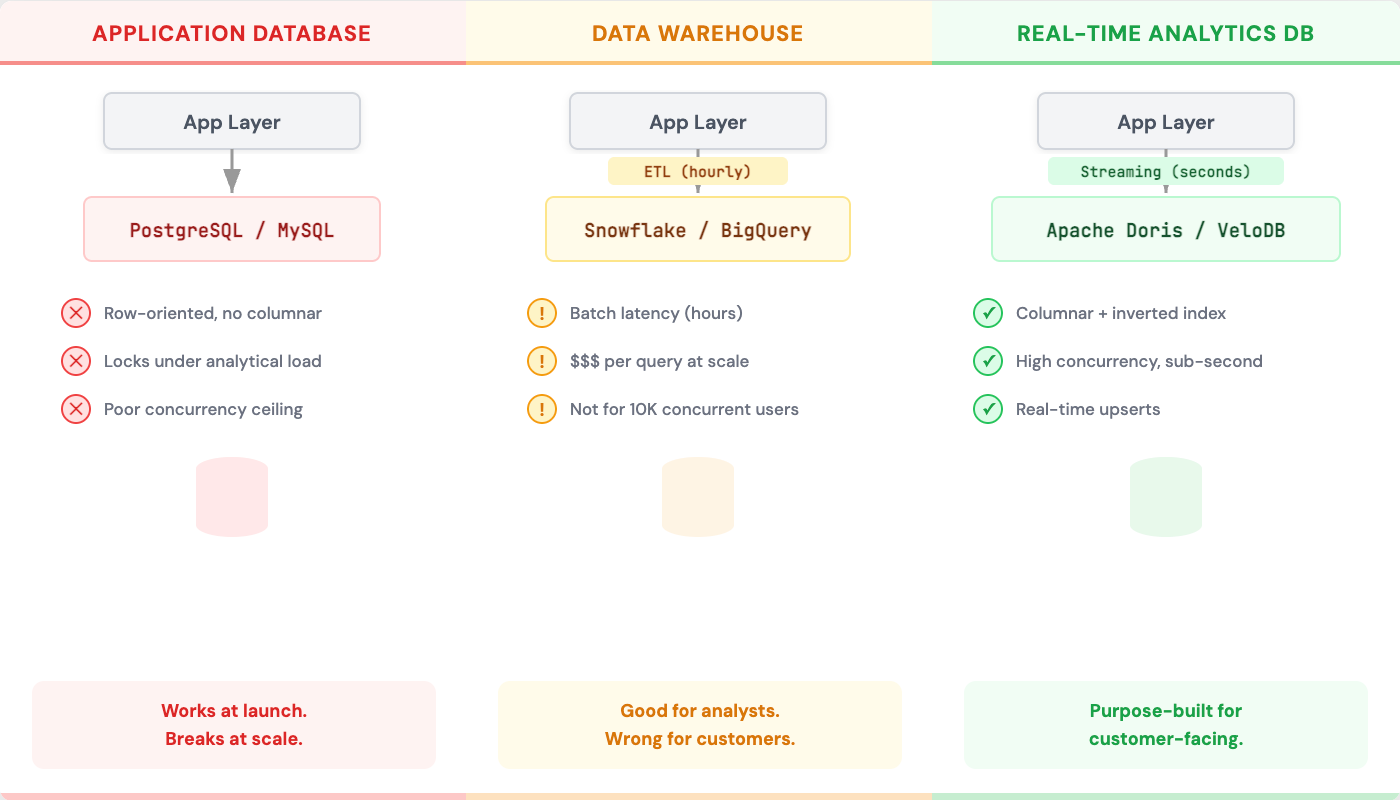
The simplest approach queries your existing PostgreSQL or MySQL database directly. This works initially but fails at scale.
Application databases optimize for transactional workloads: inserting orders, updating user profiles, recording events. Analytical queries that scan millions of rows compete with these transactions, degrading application performance.
Worse, application databases lack features essential for analytics: columnar storage for efficient aggregations, inverted indexes for multi-dimensional filtering, and materialized views for pre-computed metrics.
This approach might work for early-stage products with limited data and users. It will not work when either scale increases.
Using a Data Warehouse
Traditional data warehouses like Snowflake, BigQuery, and Redshift handle analytical queries well. However, they're designed for batch workloads: nightly ETL jobs that refresh data, scheduled queries that generate reports.
Data warehouses struggle with customer-facing requirements. They're not designed for thousands of concurrent queries. They don't optimize for sub-second latency on simple queries. They assume data freshness measured in hours, not seconds.
Cost models also conflict. Data warehouses charge for compute time, making unpredictable query volumes from millions of users expensive to budget.
Using Real-Time Analytics Databases
Purpose-built real-time analytics databases address the specific requirements of customer-facing analytics. These systems optimize for high concurrency, low latency, and fresh data simultaneously.
Key capabilities include:
Columnar storage enables efficient aggregations by reading only relevant columns rather than entire rows.
Vectorized query execution processes data in batches using CPU SIMD instructions, accelerating computations dramatically.
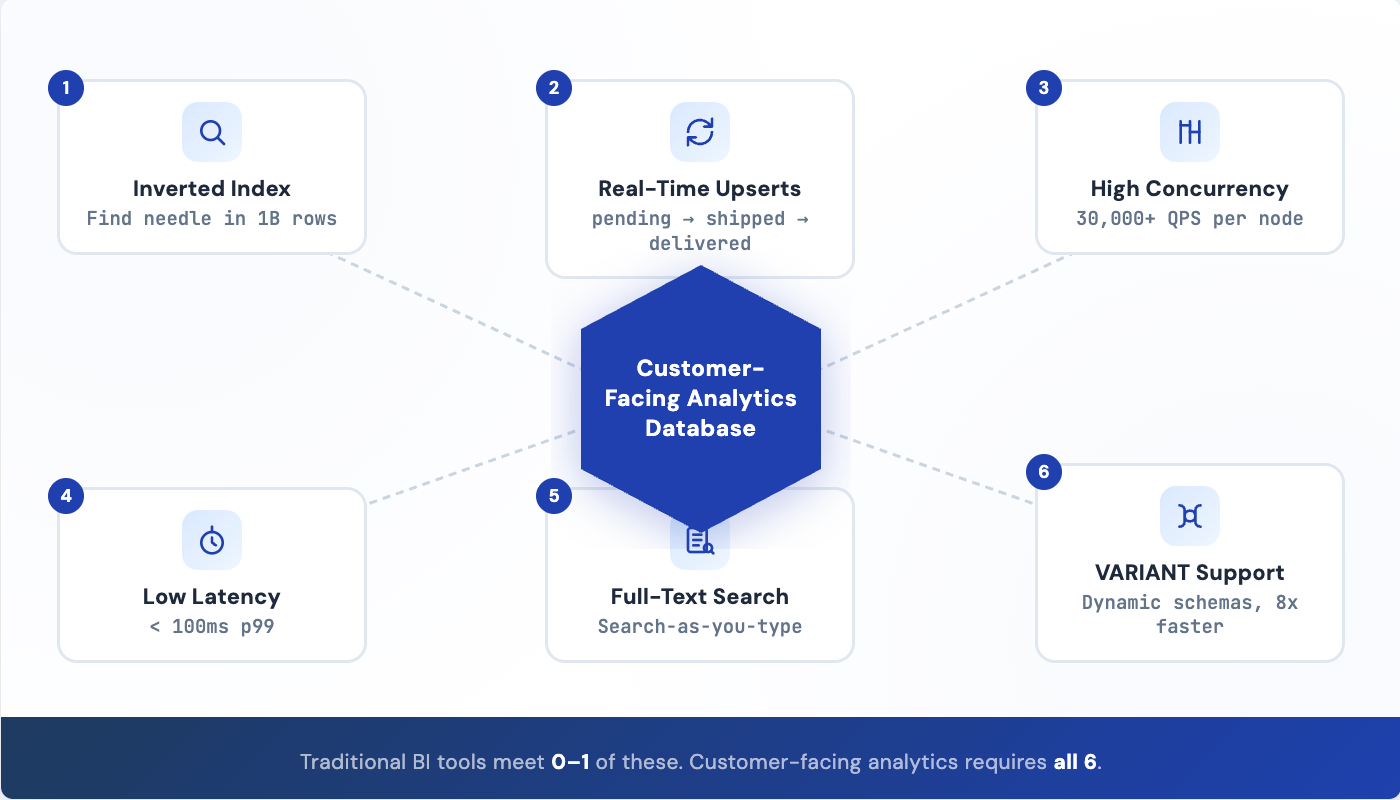
Inverted indexes solve the needle-in-haystack problem by efficiently locating specific records across multiple dimensions.
Real-time upserts handle constantly changing data states without requiring full table rebuilds.
This architecture category includes systems like Apache Doris (and its commercial distribution VeloDB), ClickHouse, and Apache Druid. Each makes different trade-offs, but all target the same use case.
Challenges of Building Customer-Facing Analytics
 Building customer-facing analytics at scale presents engineering challenges that differ fundamentally from traditional BI workloads. Understanding these challenges helps explain why specialized infrastructure exists and guides technology selection.
High Query Concurrency
Customer-facing analytics must handle query volumes that would overwhelm traditional analytical databases. When millions of users might query simultaneously, the system must support tens of thousands of queries per second.
Concurrency is often the first scaling bottleneck. A database that handles 100 analytical queries per second falls over when 10,000 users hit dashboards simultaneously. Systems designed for customer-facing workloads must architect for concurrency from the start.
Low-Latency Requirements
Users expect sub-second response times. A dashboard that takes 5 seconds to load feels broken. A search that takes 3 seconds feels slow. Analytical queries must return in hundreds of milliseconds, not seconds.
Latency compounds in dashboards that issue multiple queries. If a dashboard makes 10 queries and each takes 500ms, the total load time becomes unacceptable. Individual query latency must be measured in tens of milliseconds for dashboards to feel responsive.
The Needle-in-Haystack Problem
This is the defining technical challenge of customer-facing analytics. Your platform stores data from all customers in shared tables. Perhaps you have a billion rows representing millions of users. Each user query must locate their specific rows among the billion efficiently.
Without proper indexing, every query scans the entire table. Even with partitioning by customer ID, queries that filter on other dimensions (date ranges, status values, categories) require scanning all data for that customer.
Inverted indexes solve this problem by maintaining pre-built mappings from values to rows. When a user queries "all orders with status=shipped in the last 30 days," the inverted index identifies exactly which rows match without scanning. This transforms query performance from linear in data size to nearly constant.
Real-Time Upserts for Changing States
Customer data changes constantly. An order progresses from pending to processing to shipped to delivered. A support ticket moves from open to in-progress to resolved. A subscription cycles through trial, active, past-due, and canceled states.
Traditional analytical databases handle this poorly. They're optimized for append-only workloads where data arrives and never changes. Supporting updates efficiently requires specialized architectures like merge-on-write with delete bitmaps.
Without efficient upserts, analytics shows stale data. Users see orders marked "processing" days after delivery. This data staleness destroys trust in the analytics.
Full-Text Search Requirements
Users expect to search within text fields. A merchant searches product names. A support agent searches ticket descriptions. A logistics worker searches tracking notes.
Basic pattern matching (LIKE queries) doesn't scale. Searching millions of text records for a substring requires scanning every record. Users expect search-as-you-type responsiveness, not multi-second waits.
Full-text search requires tokenization (breaking text into searchable terms), inverted indexes on those tokens, and query parsing that handles fuzzy matching and relevance ranking. Analytical databases must either provide these capabilities natively or integrate with external search systems, adding architectural complexity.
Semi-Structured Data Flexibility
User-generated data resists fixed schemas. Event properties vary by event type. Custom fields differ by customer configuration. Metadata includes whatever users decide to attach.
Forcing this data into rigid relational schemas creates maintenance nightmares. Every new event type requires schema changes. Every customer's custom fields need separate handling.
VARIANT or JSON column types provide flexibility by storing semi-structured data without predefined schemas. However, naive JSON storage is slow. Efficient implementations auto-columnarize JSON data, extracting commonly accessed paths into optimized columnar storage while preserving flexibility for arbitrary nested structures.
Build vs Buy: Implementing Customer-Facing Analytics
 Every team building customer-facing analytics faces the build versus buy decision. The right choice depends on your engineering resources, timeline, and how central analytics is to your product differentiation.
Building In-House
Advantages of building:
Complete control over the user experience. Every interaction can be designed precisely to your product's needs without compromise.
No vendor dependencies. You're not subject to another company's pricing changes, deprecation decisions, or reliability issues.
Deep integration with your domain model. Custom analytics can reflect your specific data model and business concepts without translation layers.
Disadvantages of building:
Significant engineering investment. Building production-quality analytics requires database expertise, visualization development, security implementation, and ongoing maintenance.
Slower time to market. Months of engineering work delays analytics delivery while competitors ship features.
Undifferentiated work. Unless analytics is your core product, engineering time spent on analytics infrastructure doesn't advance your actual differentiation.
Buying a Platform
Advantages of buying:
Faster deployment. Analytics platforms can be integrated in weeks rather than months.
Proven scalability. Established platforms have already solved concurrency, latency, and reliability challenges.
Ongoing improvements. Vendors continuously improve their platforms, delivering new capabilities without your engineering investment.
Disadvantages of buying:
Less customization flexibility. Your analytics must fit within the platform's paradigm and capabilities.
Vendor dependency. You're reliant on the vendor's roadmap, pricing stability, and continued existence.
Integration complexity. Connecting the platform to your data sources and application requires ongoing synchronization.
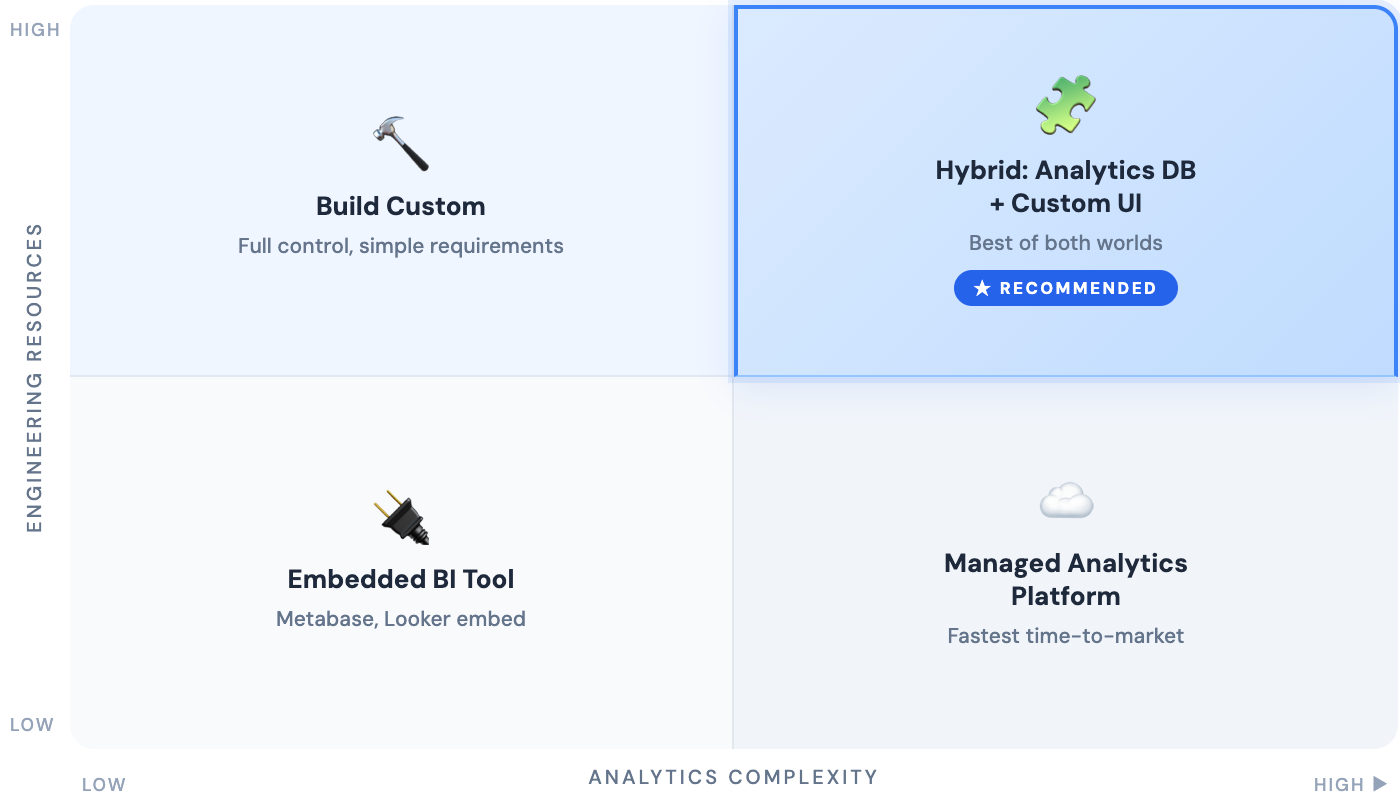
The Hybrid Approach
Many successful implementations combine approaches. A purpose-built analytics database handles the data layer, providing the performance characteristics required for customer-facing workloads. Custom application code builds the visualization and interaction layer, providing complete control over user experience.
This hybrid approach captures benefits from both sides: enterprise-grade data infrastructure without building a database, plus custom user experience without vendor UI constraints.
How to Choose the Right Customer-Facing Analytics Platform
Selecting an analytics platform requires evaluating multiple dimensions beyond raw performance. The following criteria provide a framework for comparing options.
Performance and Scalability
The platform must handle your current load with headroom for growth. Key metrics to evaluate:
Queries per second under realistic workloads. Test with concurrent users, not just sequential queries.
Query latency at the 99th percentile, not just median. Users experiencing 5-second queries won't care that median latency is 100ms.
Scaling characteristics as data and users grow. Linear scaling is acceptable. Superlinear scaling is a red flag.
Developer Experience
Analytics infrastructure is something your engineering team lives with daily. Evaluate:
Query interface familiarity. SQL-compatible systems reduce learning curves.
Integration options with your existing data pipeline. Native connectors to Kafka, databases, and file systems reduce glue code.
Documentation and community resources for troubleshooting and best practices.
Cost and Operational Complexity
Total cost includes more than license fees:
Infrastructure costs for compute and storage at projected scale.
Operational burden of running and maintaining the system. Managed services reduce ops load but increase direct costs.
Engineering time for integration, optimization, and ongoing maintenance.
Integration with Existing Data Stack
Analytics platforms must fit your current architecture:
Data ingestion from your existing sources: application databases, event streams, file systems.
Authentication integration with your identity provider for seamless user experience.
API compatibility with your application stack for programmatic access.
Future Trends in Customer-Facing Analytics
The analytics landscape continues evolving as AI capabilities mature and user expectations rise. Several trends will shape customer-facing analytics in the coming years.
AI-Powered Insights
Natural language interfaces will let users ask questions in plain English rather than building queries or navigating dashboards. "Why did my sales drop last week?" yields an explanation, not just a chart.
Automated insight detection will surface anomalies and trends proactively. Instead of users discovering problems, the system alerts them to significant changes requiring attention.
Conversational Analytics
Chat-based interfaces will complement traditional dashboards. Users will ask follow-up questions, request clarifications, and explore data through dialogue rather than clicks.
This shift requires analytics systems that can interpret intent, not just execute queries. The combination of large language models with structured data queries enables new interaction paradigms.
Embedded AI Recommendations
Analytics will evolve from showing what happened to recommending what to do. A merchant seeing declining sales won't just see the trend; they'll see suggested actions with predicted impact.
This evolution requires analytics systems that integrate predictive models alongside historical data, combining descriptive and prescriptive capabilities.
Common Mistakes to Avoid
Teams building customer-facing analytics often repeat the same mistakes. Awareness of these pitfalls helps avoid costly rework.
Overcomplicating the User Experience
Analytics designed by data analysts for data analysts overwhelms typical users. Dashboards with dozens of charts, filters with countless options, and interfaces requiring training all reduce adoption.
Start simple. Show the metrics that matter most prominently. Reveal complexity progressively for users who need it. Default views should answer the most common questions without any interaction required.
Treating Analytics as a One-Time Project
Analytics requirements evolve with your product. New features generate new data. User feedback reveals missing metrics. Market changes alter what matters.
Build analytics infrastructure that supports iteration. Schema flexibility accommodates new data types. Configurable dashboards allow adding metrics without engineering changes. Feedback mechanisms capture what users want to see.
Ignoring Performance at Scale
Analytics that work perfectly with 1,000 users may collapse at 100,000. Database queries that complete in 100ms at launch may take 10 seconds after a year of data accumulation.
Plan for scale from the start. Choose infrastructure designed for your target user count and data volume, not your current numbers. Build monitoring that catches performance degradation before users complain.
Underestimating Security Requirements
A data breach in customer-facing analytics exposes not just your company's data but your customers' data. The reputational and legal consequences multiply.
Row-level security must be bulletproof. Authentication cannot have edge cases where users see others' data. Audit trails must capture all access for compliance and forensics.
How to Build Customer-Facing Analytics with VeloDB
 Building customer-facing analytics is less about creating charts and more about meeting strict backend requirements: sub-second latency, high concurrency, real-time freshness, and predictable performance under multi-tenant load. At a certain scale, these constraints stop being “dashboard problems” and become database and architecture problems.
VeloDB, the commercial distribution of Apache Doris, is designed specifically for these customer-facing analytics workloads—where interactive queries must remain fast even as data volume, user counts, and dimensional complexity grow.
- High concurrency at scale. VeloDB handles 30,000+ queries per second per node, scaling horizontally as user counts grow. Millions of concurrent users can query dashboards simultaneously without degradation.
- Efficient needle-in-haystack queries. Built-in inverted indexes on any column enable efficient filtering across multiple dimensions. Queries like "all orders for customer X with status Y in date range Z" execute in milliseconds regardless of total data volume.
- Real-time data freshness. Merge-on-write architecture with delete bitmaps enables efficient upserts. Order status changes reflect in analytics immediately, not after nightly batch jobs.F
- Full-text search capabilities. Inverted indexes with tokenization support MATCH_ALL and MATCH_ANY queries for searching within text fields. Users can search product names, descriptions, and messages with sub-second response.
- Flexible semi-structured data. The VARIANT type auto-columnarizes JSON data, providing 8x performance improvement over naive JSON storage while preserving schema flexibility for dynamic data structures.
- Standard SQL interface. MySQL protocol compatibility means existing tools and expertise apply directly. No new query languages to learn.
For teams building customer-facing analytics, VeloDB eliminates the database layer challenges, letting engineers focus on the visualization and user experience that differentiates their product.
Ready to build analytics that your customers will actually use? Explore how VeloDB handles the database challenges of customer-facing analytics at scale — and sign up to try it yourself.