Why Graph Search With Your Structured Data?
Apache Doris excels at flat, aggregation-heavy OLAP queries: dashboards, reporting, time-series analytics. With sub-second query performance, streaming ingestion, and hybrid search and analytical processing (HSAP) capabilities, it already serves as the backbone for real-time BI at scale.
But some of the highest-value questions are not about aggregations. They are about relationships: who is connected to whom, what depends on what, which chain of events led here. These relationship-heavy questions are exactly where SQL-based analytics can struggle, and where graph search can help.
Use Cases That Demand Graph Search
Use Cases that Benefit from Graph Search
| Use Case | Why Graph Search Helps |
|---|---|
| Alerting & Root Cause Analysis | A flat alert table only tells you what happened. Graph traversal tells you why by tracing dependency chains and correlating related alerts through shared entities. |
| Context Engineering for AI Agents | Graph search adds the missing dimension to Doris's hybrid search: traversing relationships between results so agents can reason over how entities connect, not just what they contain. This enables multi-hop reasoning that vector-only RAG cannot support. |
| Fraud Detection & Financial Risk | Tracing hidden connections across accounts, devices, and transactions requires multi-hop traversal. Ring structures and shared-entity patterns are invisible in tabular views but immediately apparent in a graph. |
| Cybersecurity & Threat Analysis | Mapping lateral movement paths, tracing attack chains, and identifying exposed assets all depend on graph traversal, something a WHERE clause cannot express at depth. |
| Supply Chain & Operational Visibility | Multi-tier supplier relationships and logistics dependencies are naturally graph-shaped. Impact analysis ("if this supplier goes down, what's affected?") requires traversal that would demand dozens of self-JOINs in SQL. |
Challenges With Existing Approaches
These use cases are compelling, but if you try to address them with existing tools, you quickly hit fundamental limitations:
-
SQL JOINs don't scale with depth: Multi-hop queries require stacking JOINs across tables, and performance degrades exponentially with each hop. Apache Doris is optimized for wide scans and aggregations, not recursive relationship traversal. These are complementary strengths, not competing ones.
-
Dedicated graph databases mean duplication and staleness: Traditional graph databases like Neo4j require extracting data from Apache Doris into a separate store. This creates data duplication, pipeline maintenance overhead, and replication lag. For alerting, fraud detection, and security, even minutes of staleness can mean missing an incident.
-
Operational complexity doubles: Running a dedicated graph database alongside Apache Doris means two systems to scale, monitor, and secure, with twice the infrastructure cost and team overhead.
The Solution: PuppyGraph Over Apache Doris
PuppyGraph is a graph analytics engine that connects directly to existing data sources, enabling teams to run graph queries without a separate graph database or data migration.
A solution to address the challenges listed above is for PuppyGraph to connect directly to Apache Doris via its MySQL-compatible protocol, mapping your existing tables and views into graph structures (vertices and edges) with zero ETL and no data duplication. It then enables graph queries using Cypher and Gremlin without any data migration.
By integrating PuppyGraph with Apache Doris, you combine Doris's strengths (real-time analytics, hybrid search, and high-concurrency access) with graph traversal capabilities:
-
Zero data migration: Model graph structures directly on Doris tables and views. Your Doris warehouse remains the single source of truth.
-
Graph query capabilities: Perform relationship traversal, path analysis, and multi-hop queries using Cypher or Gremlin, the kinds of queries that would require dozens of stacked JOINs in SQL.
-
Real-time data analysis: Changes in Doris data are immediately reflected in PuppyGraph query results. No batch ETL, no replication lag.
The rest of this guide walks through exactly how to set this up: deploying PuppyGraph, connecting it to Doris, modeling a graph schema, and running your first graph queries.
How It Works
PuppyGraph connects to Apache Doris via JDBC (MySQL protocol) to read metadata and data from tables and views. Here's how the overall workflow looks:
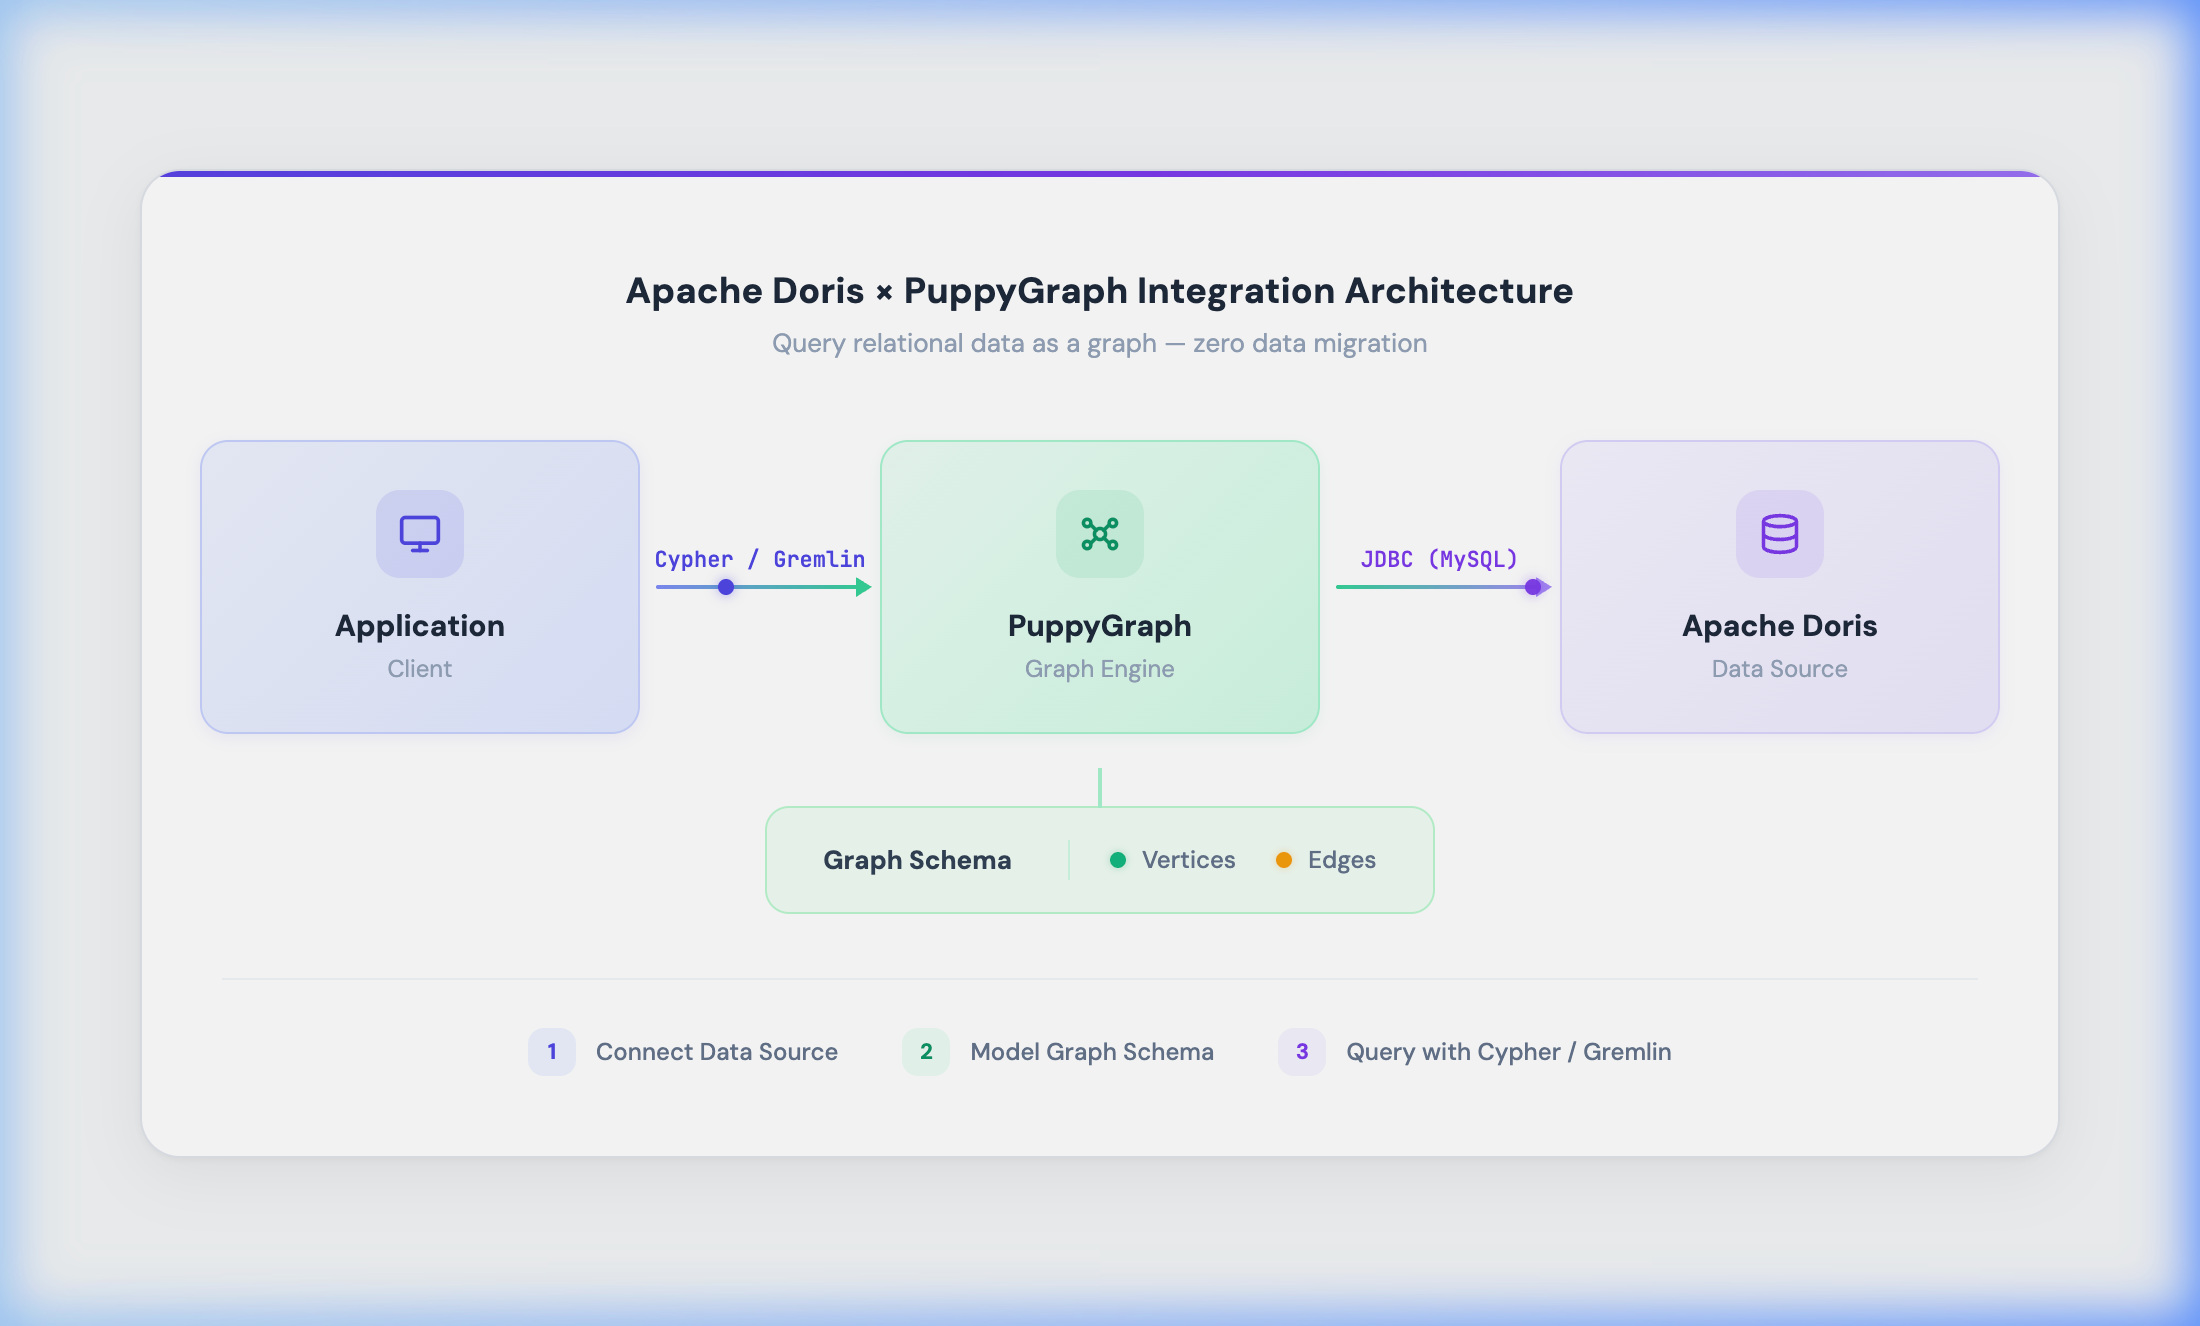
You follow three phases:
-
Connect to the data source: Create a Catalog in PuppyGraph, configure the JDBC connection, and connect to Apache Doris.
-
Model the graph schema: Map tables or views in Apache Doris to graph vertices and edges.
-
Execute graph queries: Query the graph using Cypher or Gremlin. PuppyGraph allows you to query your Apache Doris tables as a graph, no separate graph database required.
Tips: PuppyGraph uses the MySQL 8 JDBC driver (mysql-connector-java-8.0.28) to connect through Apache Doris's MySQL-compatible protocol port (default 9030).
Prerequisites
Before you begin, ensure the following requirements are met:
| Component | Requirement |
|---|---|
| Apache Doris | Deployed and running, with the MySQL protocol port accessible (default 9030) |
| Docker & Docker Compose | Installed and functional |
| Web browser | For accessing the PuppyGraph Web UI |
Run the following command to verify that Docker Compose is ready:
docker compose version
Note: If Docker Compose is not yet installed, refer to the Docker Compose installation guide.
Steps
Step 1: Deploy PuppyGraph
-
Create a project directory:
mkdir doris-puppygraph && cd doris-puppygraph -
Create a
docker-compose.yamlfile with the following content:services: puppygraph: image: puppygraph/puppygraph:stable restart: unless-stopped ports: - "8081:8081" # Web UI - "8182:8182" # Gremlin endpoint - "7687:7687" # Bolt endpoint (Cypher) environment: - PUPPYGRAPH_PASSWORD=${PUPPYGRAPH_PASSWORD:-puppygraph123} - QUERY_TIMEOUT=${PUPPYGRAPH_QUERY_TIMEOUT:-5m} - STORAGE_PATH_ROOT=/data/storage volumes: - puppygraph_data:/data/storage extra_hosts: - "host.docker.internal:host-gateway" volumes: puppygraph_data: -
Start the service and verify its status:
docker compose up -d
docker compose ps
Confirm that the
puppygraphcontainer status isrunningbefore proceeding.
Once the service is running, PuppyGraph services are accessible through the following ports:
| Service | Address | Description |
|---|---|---|
| Web UI | http://localhost:8081 | Graph schema management and visual query interface |
| Gremlin endpoint | localhost:8182 | Gremlin query endpoint |
| Bolt endpoint (Cypher) | localhost:7687 | Cypher query endpoint |
Step 2: Prepare Sample Data in Apache Doris
Tip: If you already have an existing database and tables, you can skip this step and proceed directly to Step 3.
Connect to Doris:
mysql -h 127.0.0.1 -P 9030 -u root
2.1 Create the Database and Orders Table
CREATE DATABASE IF NOT EXISTS demo;
USE demo;

CREATE TABLE IF NOT EXISTS orders (
    order_id    BIGINT,
    user_id     BIGINT,
    amount      DECIMAL(12,2),
    city        VARCHAR(32),
    ts          DATETIME
)
DUPLICATE KEY(order_id)
DISTRIBUTED BY HASH(order_id) BUCKETS 8
PROPERTIES ("replication_num" = "1");
2.2 Insert Sample Data
INSERT INTO orders (order_id, user_id, amount, city, ts) VALUES
    (200000, 10001, 88.80,  'Beijing',   NOW()),
    (200001, 10002, 199.90, 'Shanghai',  NOW()),
    (200002, 10003, 56.70,  'Shenzhen',  NOW()),
    (200003, 10001, 320.00, 'Beijing',   NOW()),
    (200004, 10002, 45.50,  'Guangzhou', NOW());
2.3 Create Graph Mapping Views
PuppyGraph maps each table (or view) in Doris to a type of vertex or edge in the graph. By creating views, you can flexibly define vertex properties and edge relationships without modifying the original table structure.
User vertex view: Aggregates each user_id into a user vertex with statistical properties:
CREATE VIEW v_user AS
SELECT
    user_id,
    MAX(city)        AS city,
    MAX(ts)          AS last_order_ts,
    COUNT(*)         AS order_cnt,
    SUM(amount)      AS total_amount
FROM orders
GROUP BY user_id;
User-to-order edge view: Each row represents a "user placed an order" edge:
CREATE VIEW v_user_order_edge AS
SELECT
    user_id  AS src_user_id,
    order_id AS dst_order_id,
    amount,
    city,
    ts
FROM orders;
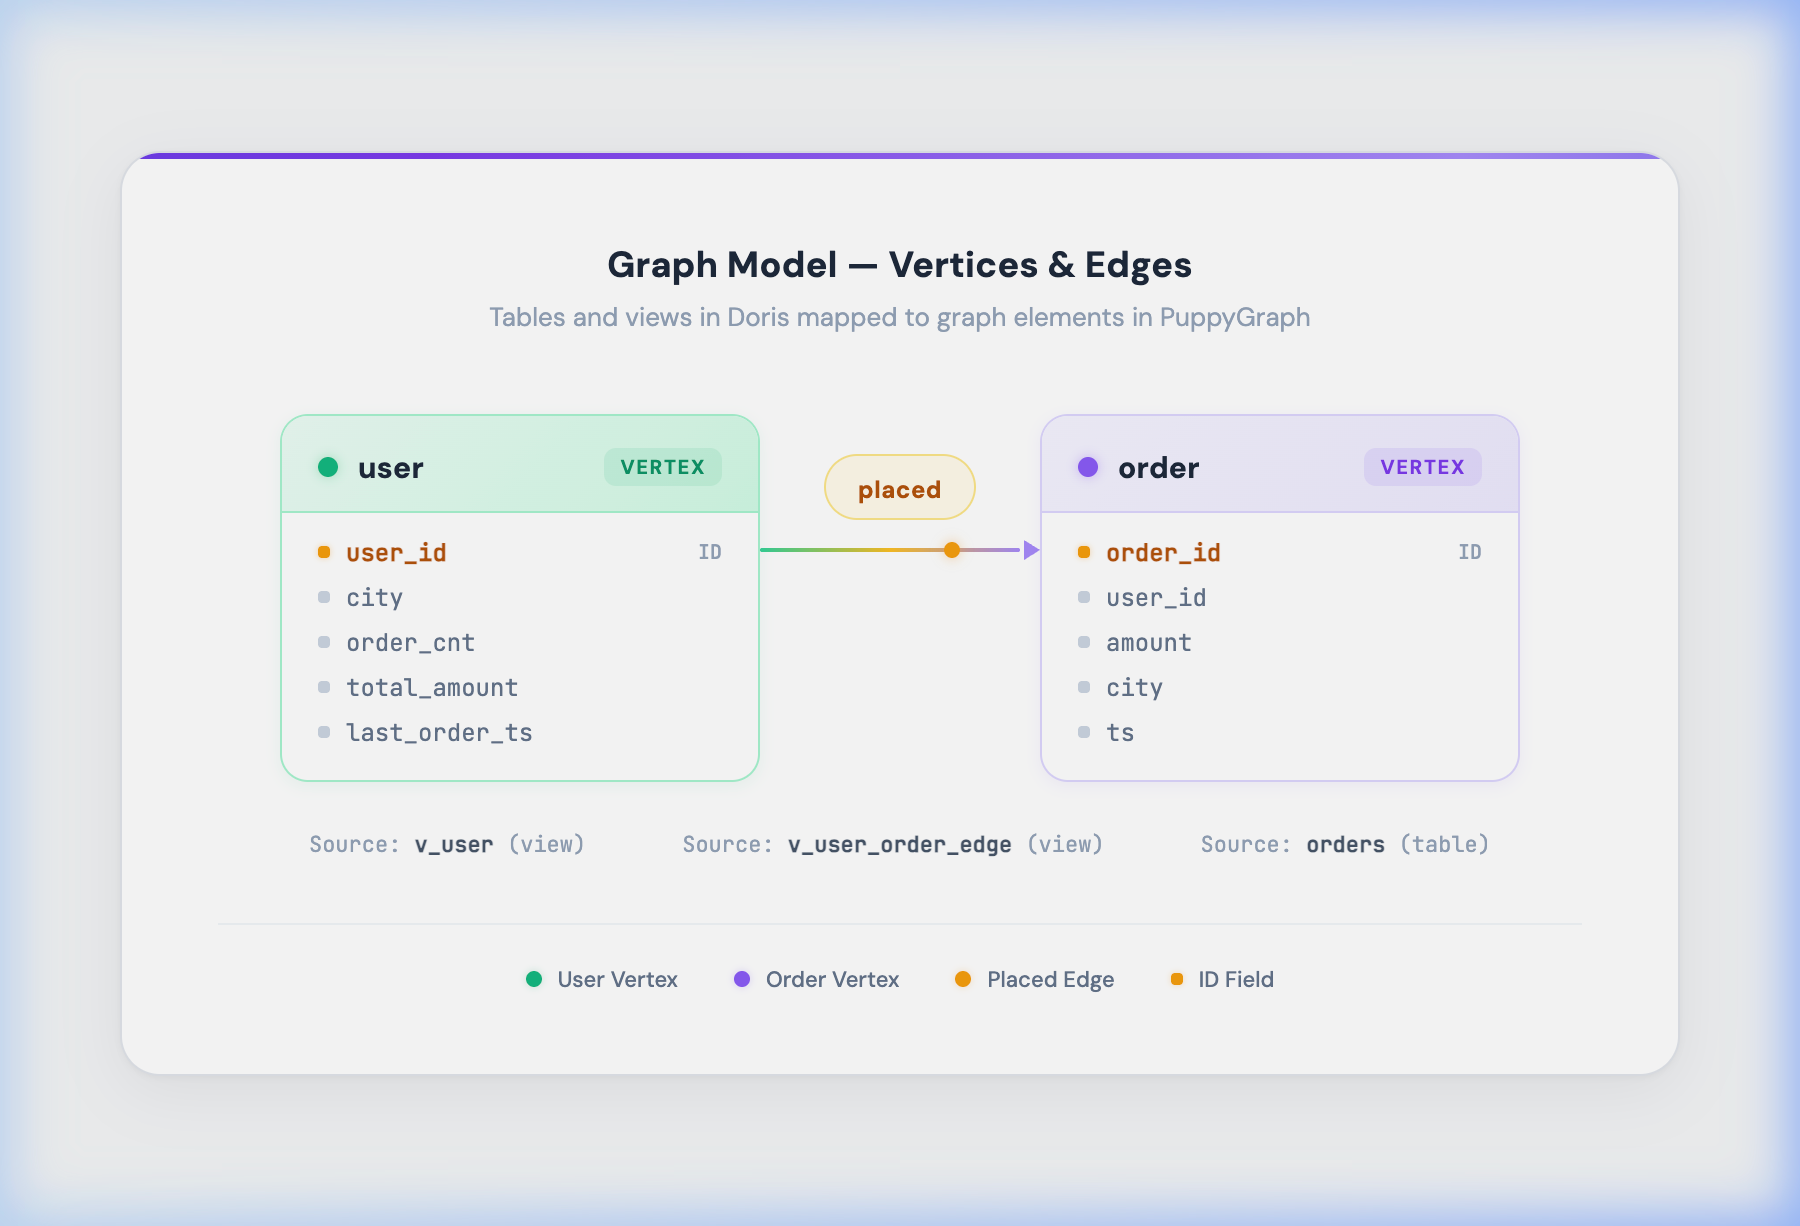
The mapping between views and graph elements is as follows:
| View | Graph Element Type | Description |
|---|---|---|
v_user | Vertex | Aggregates the orders table by user_id to produce user vertices |
orders | Vertex | The original orders table; each row represents an order vertex |
v_user_order_edge | Edge | Transforms each order record into a "user → order" edge |
Step 3: Create a Catalog in PuppyGraph
-
Open a browser and navigate to http://localhost:8081
-
Log in with the default credentials:
-
Username:
puppygraph -
Password:
puppygraph123(or the custom password you set indocker-compose.yaml)
-
-
Go to the Schema page, click Add Catalog, and fill in the following connection details:
Field Value Catalog Type MySQL 8Catalog Name doris_catalog(custom name)Username Doris account, e.g., rootPassword Doris password (leave empty if no password is set) JDBC Connection String jdbc:mysql://host.docker.internal:9030/demo?useSSL=false&allowPublicKeyRetrieval=true&serverTimezone=UTCDriver Class com.mysql.cj.jdbc.DriverURL for Downloading Driver https://repo1.maven.org/maven2/mysql/mysql-connector-java/8.0.28/mysql-connector-java-8.0.28.jarCaching JDBC Metadata ✅ Enabled JDBC Metadata Cache TTL 600 -
Click Save, then Submit to test the connection.
Note:
host.docker.internalis a special hostname that allows Docker containers to access the host machine. If Doris is deployed on a different server, replace it with the corresponding IP address.- Port
9030is the default MySQL protocol port for Doris FE. - The database name at the end of the connection string (
demo) corresponds to the database created in Step 2.
Step 4: Model the Graph Schema
After successfully connecting the Catalog, define vertices and edges in the Schema Builder.
4.1 Add Vertices
You need to add two vertex types: user and order. Click Add Node in the Schema Builder and configure each vertex according to the following table:
| Field | user Vertex | order Vertex |
|---|---|---|
| Catalog | doris_catalog | doris_catalog |
| Database | demo | demo |
| Table | v_user | orders |
| Label | user | order |
| ID | user_id | order_id |
After configuring each vertex, click Validate to verify the configuration, then click Add Node to submit.
4.2 Add an Edge
Add a placed edge to represent the "user placed an order" relationship, connecting the user vertex to the order vertex.
| Field | Value |
|---|---|
| Catalog | doris_catalog |
| Database | demo |
| Table | v_user_order_edge |
| Edge Label | placed |
| From Key(s) | src_user_id → maps to user.user_id |
| To Key(s) | dst_order_id → maps to order.order_id |
| ID | Leave empty (auto-generated by PuppyGraph) |
Click Validate to verify, then save the edge definition.
4.3 Submit the Schema
After defining all vertices and edges, click Submit / Publish to submit the graph schema. PuppyGraph will load the graph data based on the definitions.
The final graph model is shown below:
Step 5: Query the Graph
Once the graph schema is submitted, you can execute graph queries in several ways. The following sections describe how to query using the Web UI, Gremlin endpoint, and Bolt endpoint.
5.1 Querying with Cypher (Web UI / Bolt)
You can execute Cypher queries from the Query page in the PuppyGraph Web UI, or through any Bolt-compatible client (such as cypher-shell or Neo4j drivers for various programming languages) by connecting to localhost:7687.
Connecting via a Bolt client:
cypher-shell -a bolt://localhost:7687 -u puppygraph -p puppygraph123
Query examples:
-
List all users and their orders
MATCH (u:user)-[r:placed]->(o:order) RETURN u.user_id AS user_id, o.order_id AS order_id LIMIT 20; -
Get order statistics for a specific user (e.g.,
user_id = 10001)MATCH (u:user {user_id: 10001})-[r:placed]->(o:order) RETURN count(r) AS edge_cnt, count(DISTINCT o.order_id) AS distinct_order_cnt; -
Count total vertices and edges in the graph
MATCH (u:user)-[r:placed]->(o:order)
RETURN
    count(DISTINCT u.user_id) AS users,
    count(r) AS edges,
    count(DISTINCT o.order_id) AS orders;
5.2 Querying with Gremlin
You can execute Gremlin queries through the Gremlin endpoint (localhost:8182) or via the Gremlin console in the PuppyGraph Web UI.
Query examples:
-
Get all user vertices
g.V().hasLabel("user").valueMap(true) -
Get all orders for a specific user (e.g.,
user_id = 10001)g.V().hasLabel("user").has("user_id", 10001) .outE("placed").inV().hasLabel("order") .valueMap(true) -
Count the number of edges
g.E().hasLabel("placed").count()
Cleanup
To stop and remove the PuppyGraph container when it is no longer needed, run the following command:
docker compose down -v
Caution: The -v flag also deletes persistent storage volumes. Omit -v if you want to preserve the data.
FAQ
1. PuppyGraph Cannot Connect to Apache Doris
- Verify that the Doris FE node is running and the MySQL protocol port (default
9030) is open. - If PuppyGraph is running in Docker while Doris is on the host machine, use
host.docker.internalinstead of127.0.0.1orlocalhostin the JDBC connection string. - Ensure that the
docker-compose.yamlincludes theextra_hosts: - "host.docker.internal:host-gateway"configuration.
2. Graph Schema Validation Fails
- Verify that the database name specified in the JDBC connection string matches an existing database in Doris.
- Confirm that the mapped tables or views exist in Doris and are queryable.
- Ensure that ID fields do not contain
NULLvalues. PuppyGraph requires vertex and edge ID fields to be non-null.
3. Graph Queries Return Empty Results
- On the PuppyGraph Schema page, confirm that the graph schema was successfully submitted.
- Query the corresponding views directly from a Doris client to verify that data has been correctly inserted.
- Check that the From Key and To Key mappings in the edge definition correctly correspond to the vertex ID fields.