
TL;DR: With AI Observe Stack, an AI observability tool for AI Agents, the team at Apache Doris and VeloDB did a 7-day audit of a live OpenClaw agent. We found 31 autonomous shell commands, 40 external site visits, and 7.84M tokens consumed by a single user query, plus prompt injection patterns in external web content. This article covers how to properly observe and monitor AI Agents and provides a demo on how to deploy a working observability stack in 5 minutes.
OpenClaw has recently taken all the attention in the AI world, and rightly so. It's an AI Agent that can autonomously execute shell commands, browse the web, read files, send messages, and communicate with users via mainstream messaging apps like WhatsApp, Telegram, iMessages, and more.
But OpenClaw's power comes with many security risks. Within weeks of launch, security researchers found nearly 1,000 OpenClaw instances publicly accessible with no authentication, leaking API keys, bot tokens, and full chat histories. Researchers also found that a single crafted email could trick OpenClaw into handing over private SSH keys via prompt injection.
To better understand the security dynamics with OpenClaw, we ran a 7-day observability audit on a live OpenClaw instance using AI Observe Stack, an open-source AI observability platform built by VeloDB and Apache Doris community. Here's what we found:
-
31 shell commands executed autonomously: file operations, network requests, with no user awareness
-
40 external websites accessed: some with prompt injection markers embedded in the returned content
-
A single user query triggered 19 rounds of LLM calls, consuming 7.84 million tokens
-
External web content returned to the Agent contained "ignore previous instructions" injection patterns
These aren't OpenClaw-specific issues. Any AI Agent that can call tools faces the same three problems: it can take actions users never authorized or even knew about, it can burn through tokens at a rate that makes no sense until you see the call chain, and when something goes wrong, there's no trail to follow.
Without observability, you're blindly trusting your agents, which could be dangerous and costly.
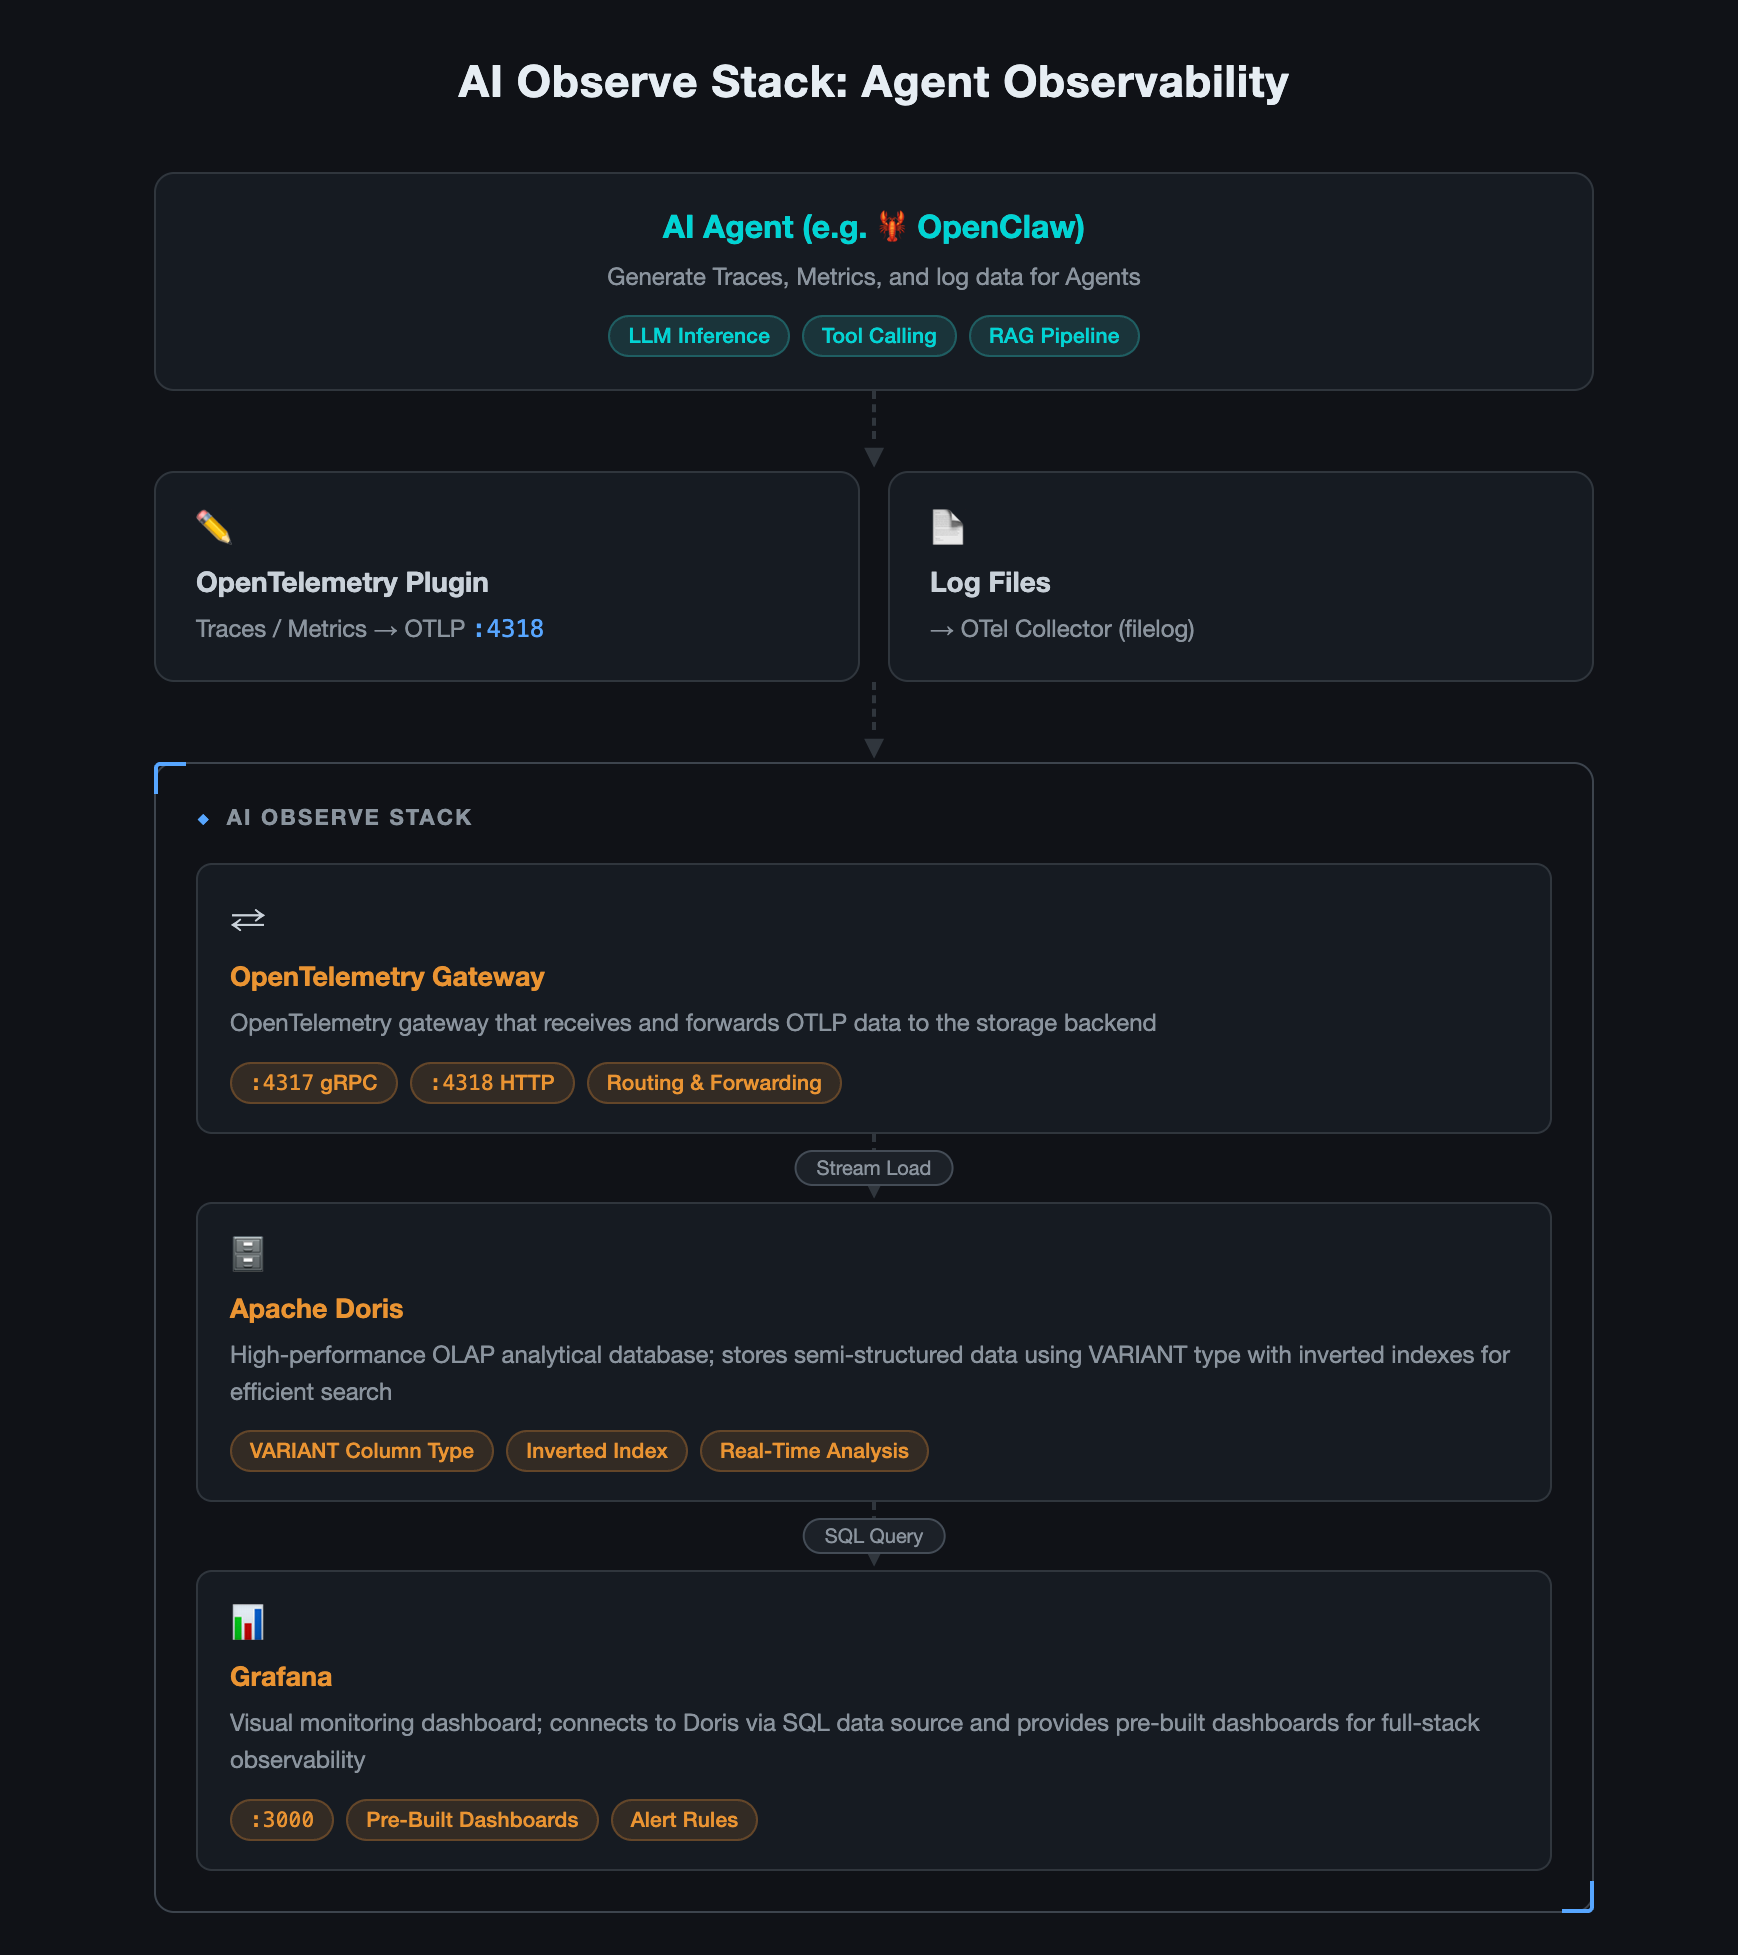
This article covers the three core black-box issues in AI Agents (security, cost, and behavior) and shows how AI Observe Stack (OpenTelemetry + Apache Doris + Grafana) makes each one visible, queryable, and auditable.
The solution works with OpenClaw, LangChain, AutoGen, CrewAI, and any other OpenTelemetry-compatible Agent. You can deploy AI Observe Stack locally in 5 minutes with open-source Apache Doris, or use VeloDB Cloud for a production-grade managed experience.
The Three AI Agent Black-Box Problems
The OpenClaw audit exposed three core black-box problems that apply to any AI Agent. Traditional software comes with logs, monitoring, and audit trails. AI Agents are different. Their behavior is non-deterministic, context-driven, and autonomously decided.
Black Box 1: Security
In our OpenClaw audit, we saw the Agent independently issue curl requests to external URLs, use exec to read and modify files, and send messages to users via gateway, all without any user input or awareness.
This isn't an OpenClaw quirk. Any AI Agent with tool-calling capabilities can run shell commands (rm -rf, sudo), read sensitive files (.ssh/id_rsa, .env), and make network requests (curl, scp).
A more dangerous scenario: when an Agent browses the web, a malicious site can embed prompt injection instructions in the page. When the Agent reads "ignore previous instructions," it may actually comply.
You often have no idea that your agent has just gone rogue due to a bad actor.
Black Box 2: Cost
The most extreme case in our audit: one user prompt triggered 19 rounds of LLM calls and spent 7.84 million tokens.
The agent's reasoning chain looked like this: search the web, browse the results, run a command, summarize the output. Each step is a separate LLM call. And each call carries the full conversation history.
So you will end up with a snowballing context window: round 1 costs 3,000 tokens, round 2 costs 8,000, round 3 costs 25,000... by round 19, you're looking at hundreds of thousands of tokens. A single question or prompt can cost 100x what you expected.
This problem is universal to AI Agents and many people are already complaining about the surprising token bill.
Black Box 3: Behavior
Without an observability layer, teams are missing key information about the agents, such as tool call error rates, exec invocation counts, and whether P95 latency on certain requests is running well above average.
When users complain that "the agent is slow" or "the agent gave the wrong answer," teams often have nothing to debug with if they don't have agent observability. Was it because the LLM was slow, a tool call failed, or the agent got stuck in a loop?
The Solution: AI Observe Stack
AI Observe Stack is an open-source observability platform built specifically for AI Agent workloads. It's built on three mature open-source projects:
| Component | Role |
|---|---|
| OpenTelemetry Collector | Telemetry gateway: ingests data using the OpenTelemetry protocol |
| Apache Doris | Storage: VARIANT type + inverted index, purpose-built for semi-structured data |
| Grafana + Doris App plugin | Visualization: Supporting SQL queries and pre-built dashboards |
Architecture
Key advantages:
-
Unified Traces + Metrics + Logs: one pipeline for collection, storage, and querying agent observability; not three separate systems
-
SQL queries: no new query language to learn; standard SQL works across all data
-
Real-time analysis: data is queryable as soon as it's written; no ETL, no pre-aggregation required
-
Fast deployment:
docker compose up -dcommand
Note: This article uses open-source Apache Doris for the demo. If your AI Agent is already running in production and you need higher availability, elastic scaling, and zero ops overhead, VeloDB Cloud offers a fully managed service built on Apache Doris, with production-grade observability storage, ready out of the box.
How we Observed OpenClaw with AI Observe Stack
We connected the AI Observe Stack to a live OpenClaw environment. Everything below is real data from that instance, surfaced through three pre-built dashboards.
1. Security Audit: What Commands Is Your Agent Running?
Open the Security & Audit Dashboard. This should be the most important dashboard to check. Anything in red needs immediate attention. Four metric cards give you the immediate picture:
-
Dangerous Commands: detected shell commands with high-risk potential (
rm -rf,sudo,chmod 777,curl | sh, etc.) -
Prompt Injection: injection patterns found in external content (
ignore previous instructions,you are now,DAN mode, etc.) -
Outbound Actions: proactive outbound operations initiated by the Agent (emails sent, messages delivered, external API calls made)
-
Sensitive File Access: how many times the Agent accessed sensitive files (
.ssh/id_rsa,.env,credentials.json, etc.)
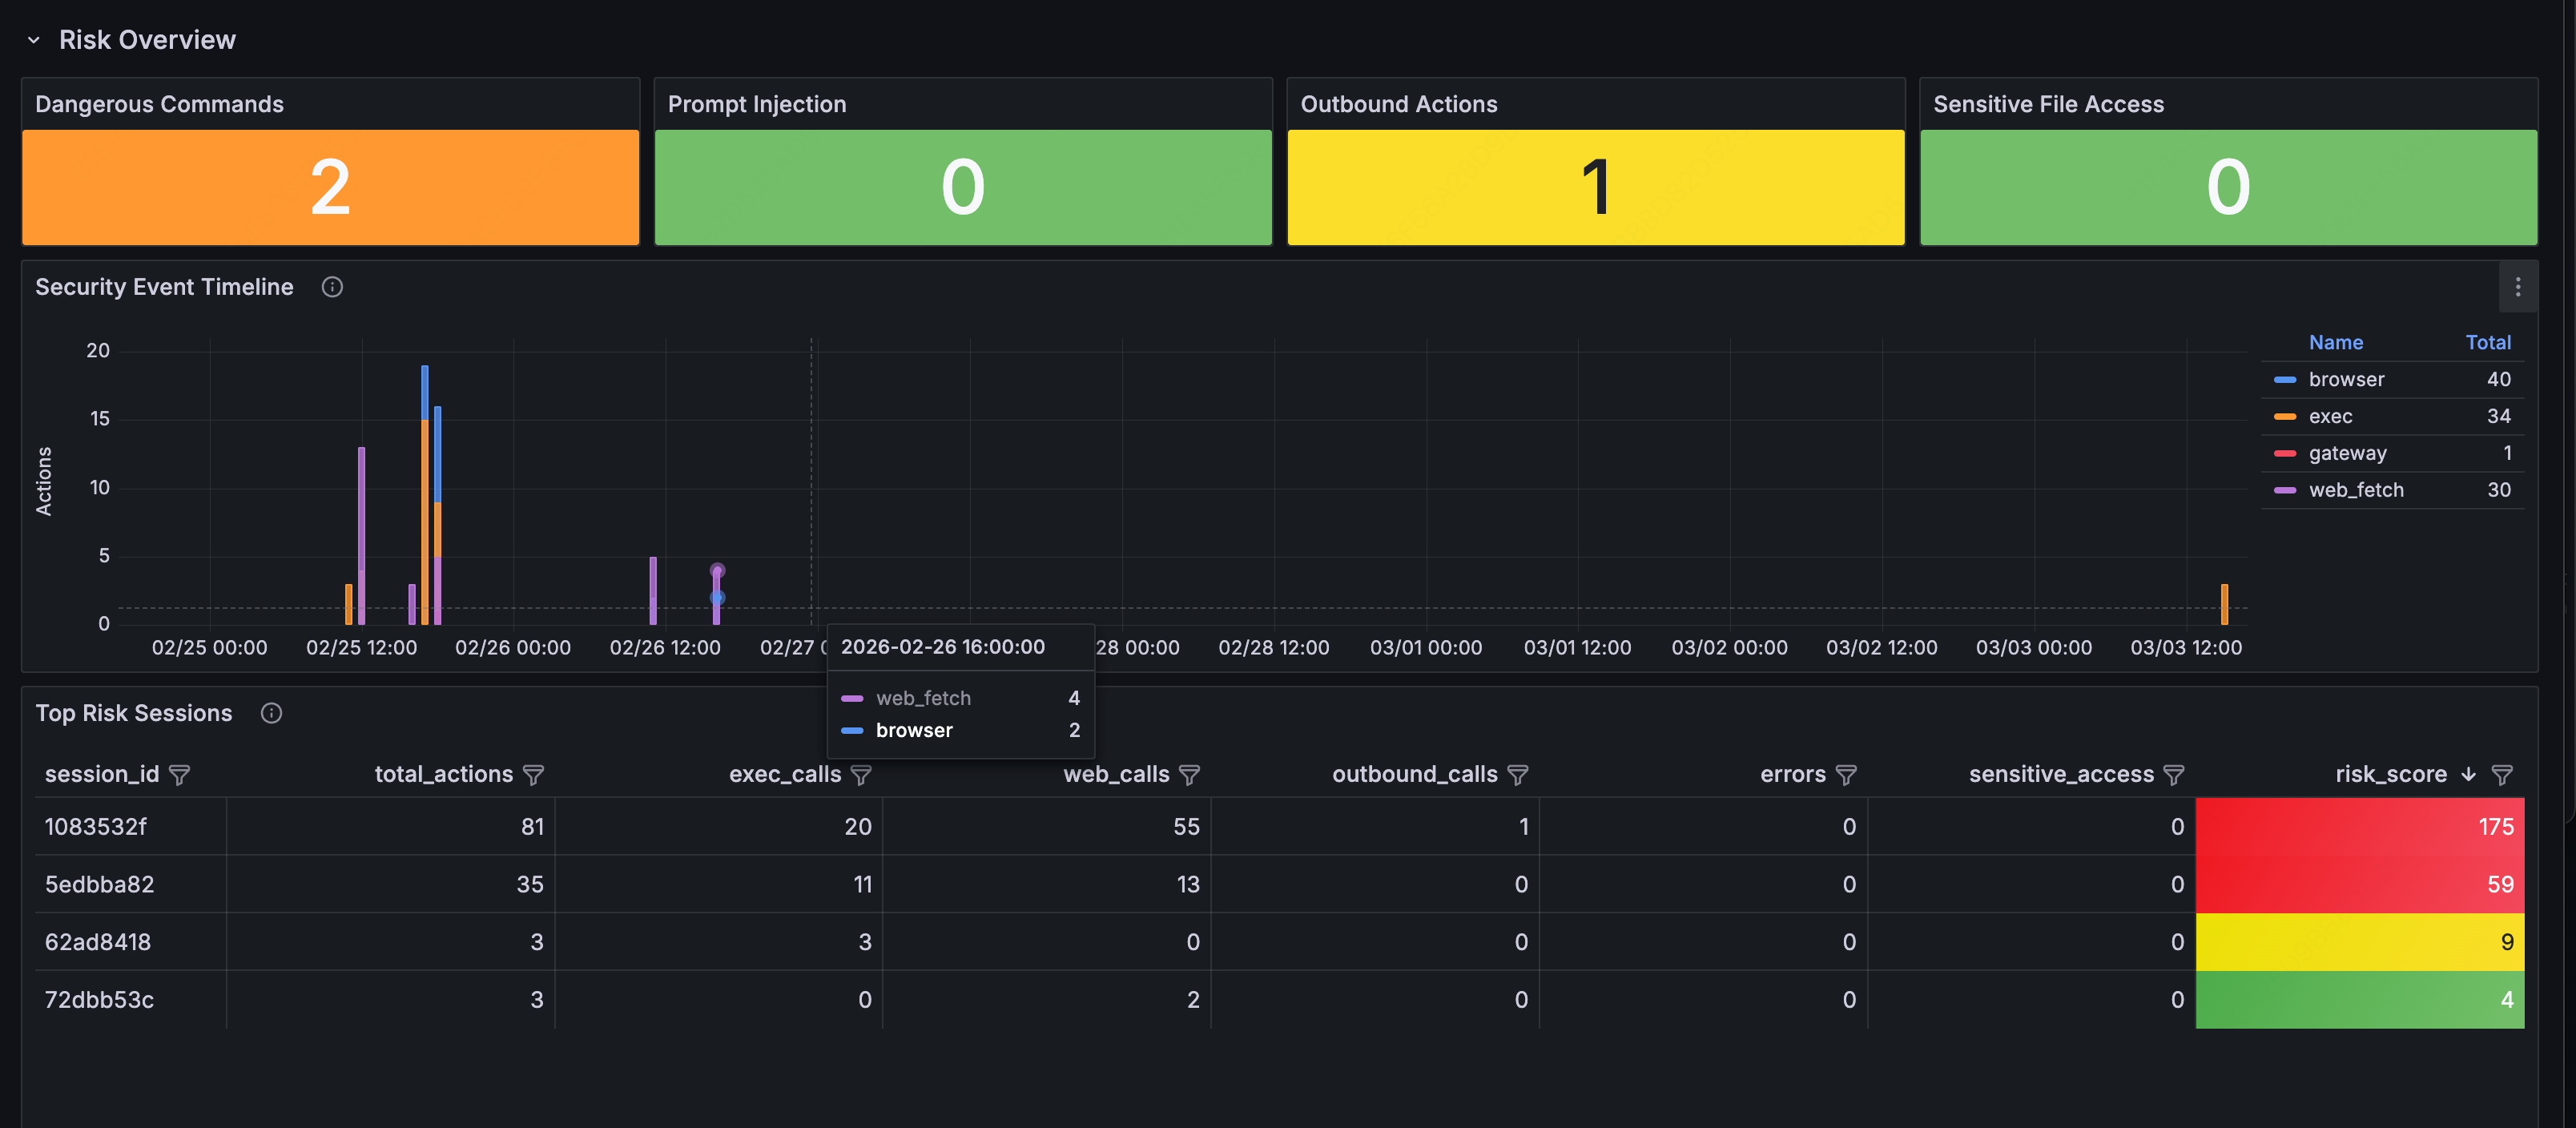
Security Event Timeline
The timeline below shows how security events are distributed over time:
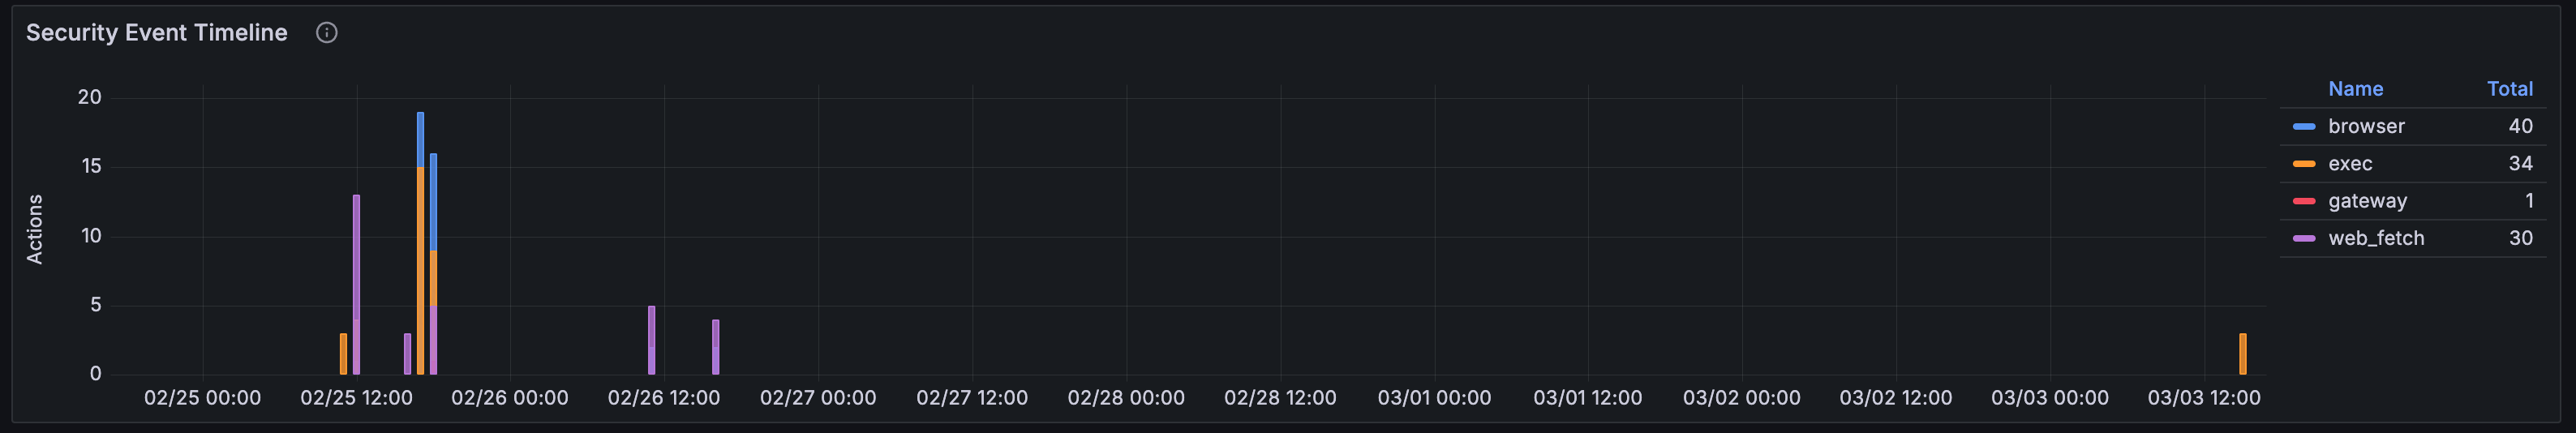
Each color represents a category: orange for shell command execution, blue for browser operations, purple for web scraping, red for gateway calls. An unusual spike, for example, a burst of shell commands at 3 am, is worth investigating.
Top Risk Sessions
Check the Top Risk Sessions table to see which sessions were riskiest. The session table ranks them by risk score:
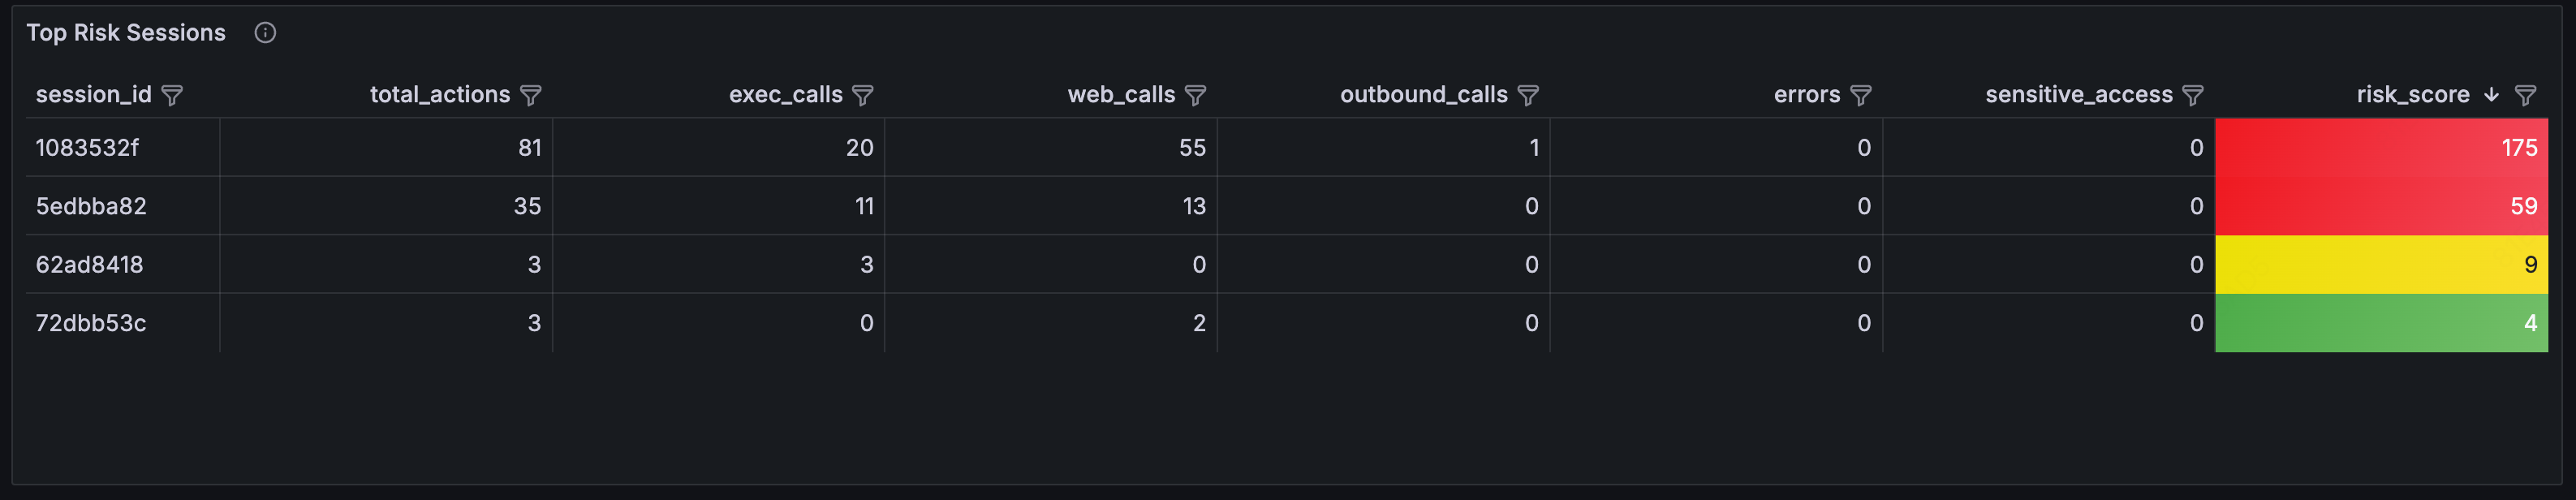
Risk scoring algorithm: exec×3 + web×2 + outbound×5 + error×1 + sensitive_file×10. Higher scores go to the top of the review queue.
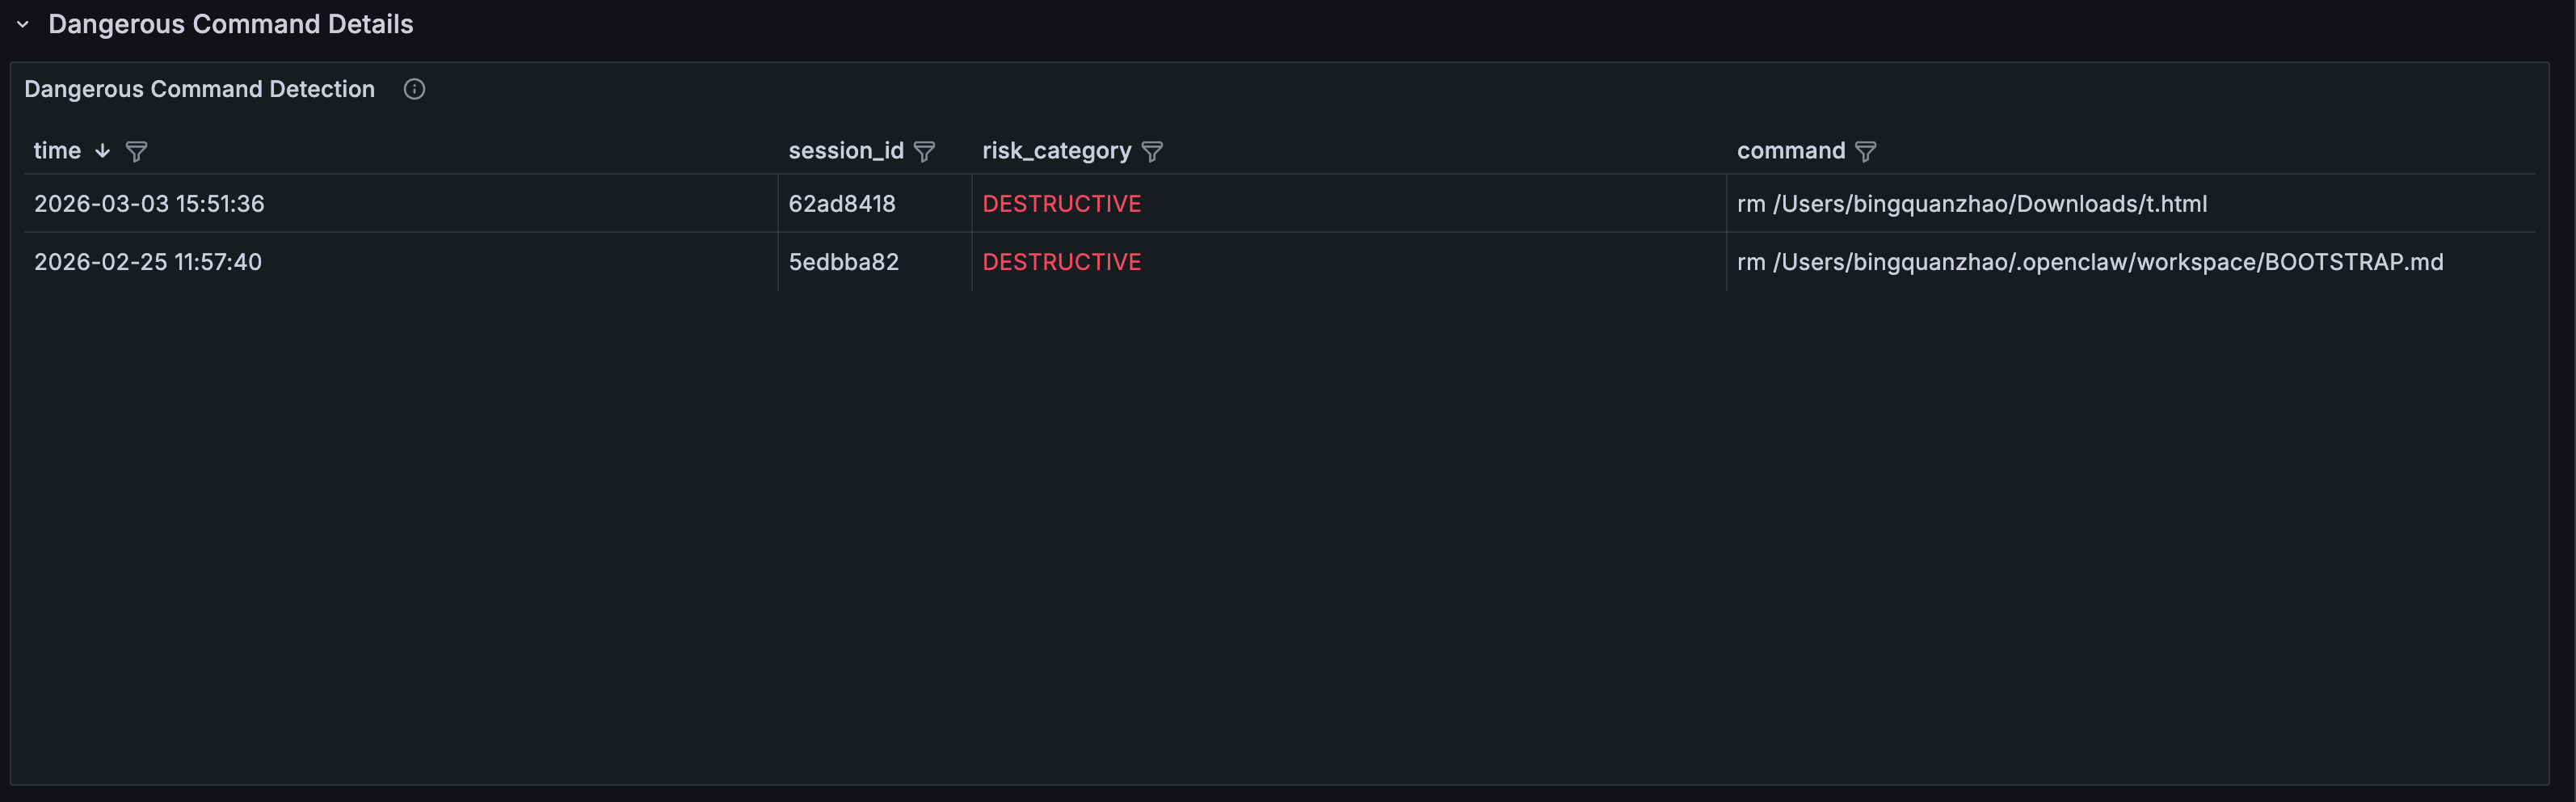
You can expand any row for detailed records by risk category:
- Dangerous Command Detection: timestamp, session ID, risk category (DESTRUCTIVE / PRIVILEGE_ESCALATION / DATA_EXFIL / CREDENTIAL_ACCESS), and full command content
- Prompt Injection Detection: detected injection content, risk type (INJECTION_PATTERN / ROLE_HIJACK / HIDDEN_INSTRUCTION / JAILBREAK), and source tool
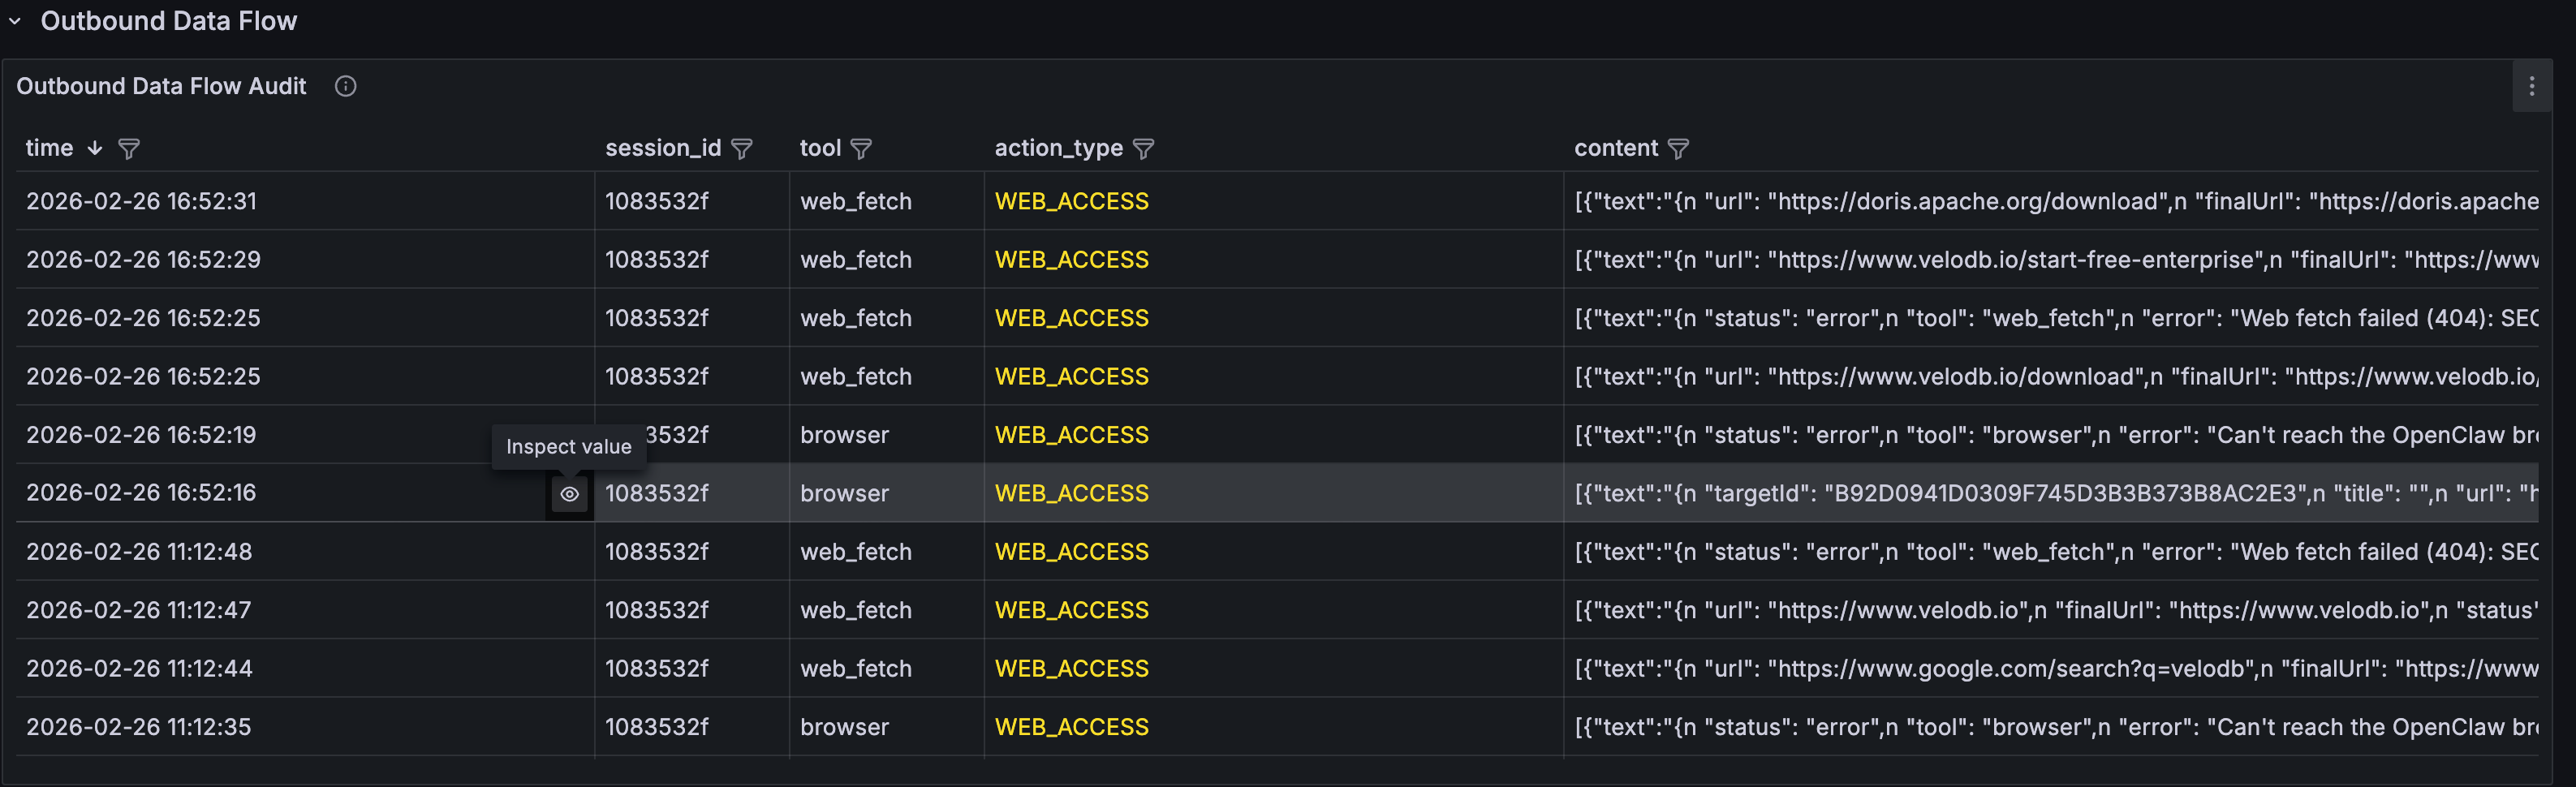
- Outbound Data Flow Audit: complete log of all outbound operations: emails sent, messages delivered, network requests made
- Sensitive File Access Log: file access details, grouped by type (SSH_KEY / ENV_FILE / CREDENTIALS, etc.)
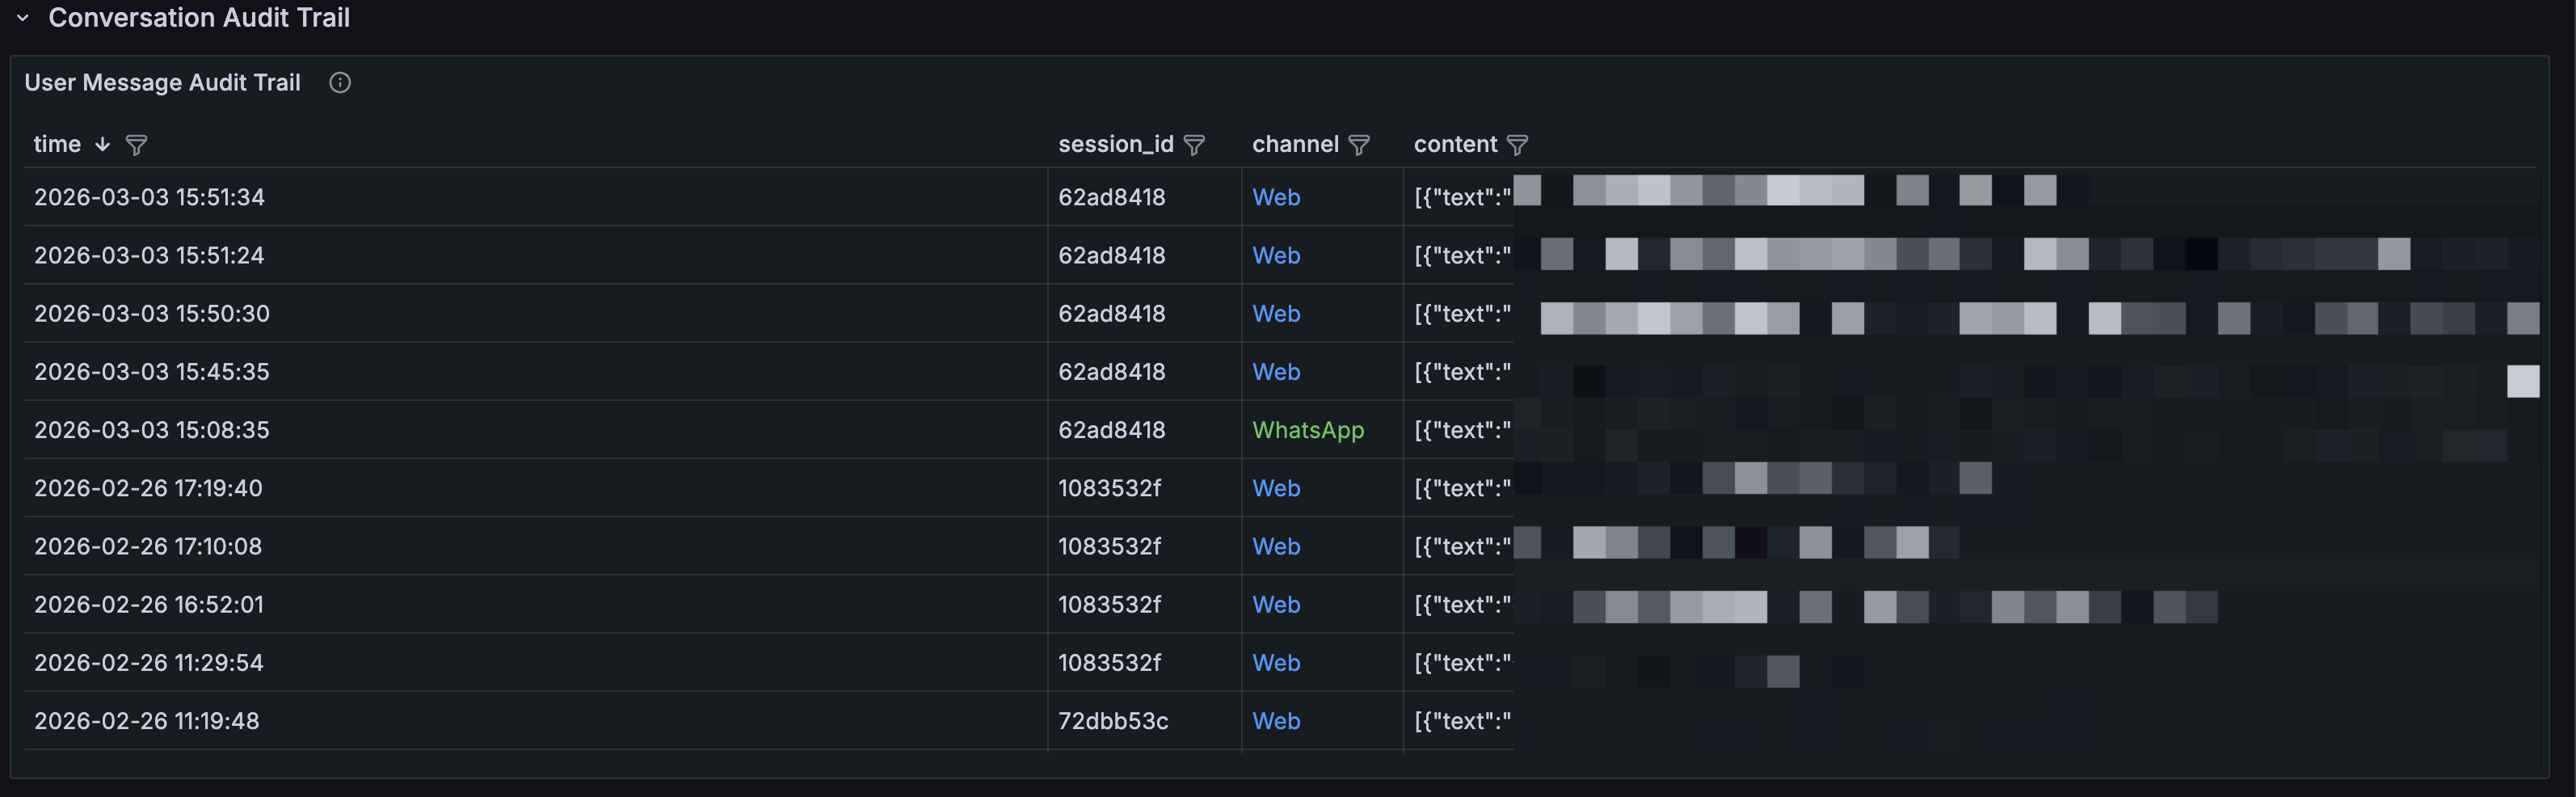
- User Message Audit Trail: full message audit log by channel (WhatsApp / Web), searchable and filterable
- Tool Execution Log: complete log of every tool call: tool name, execution status (OK / ERROR), and return content. Useful for forensic analysis

- Tool Calls vs Errors Over Time: trend comparison of total tool calls versus error count. A spike in error rate may indicate the Agent is attempting unauthorized operations
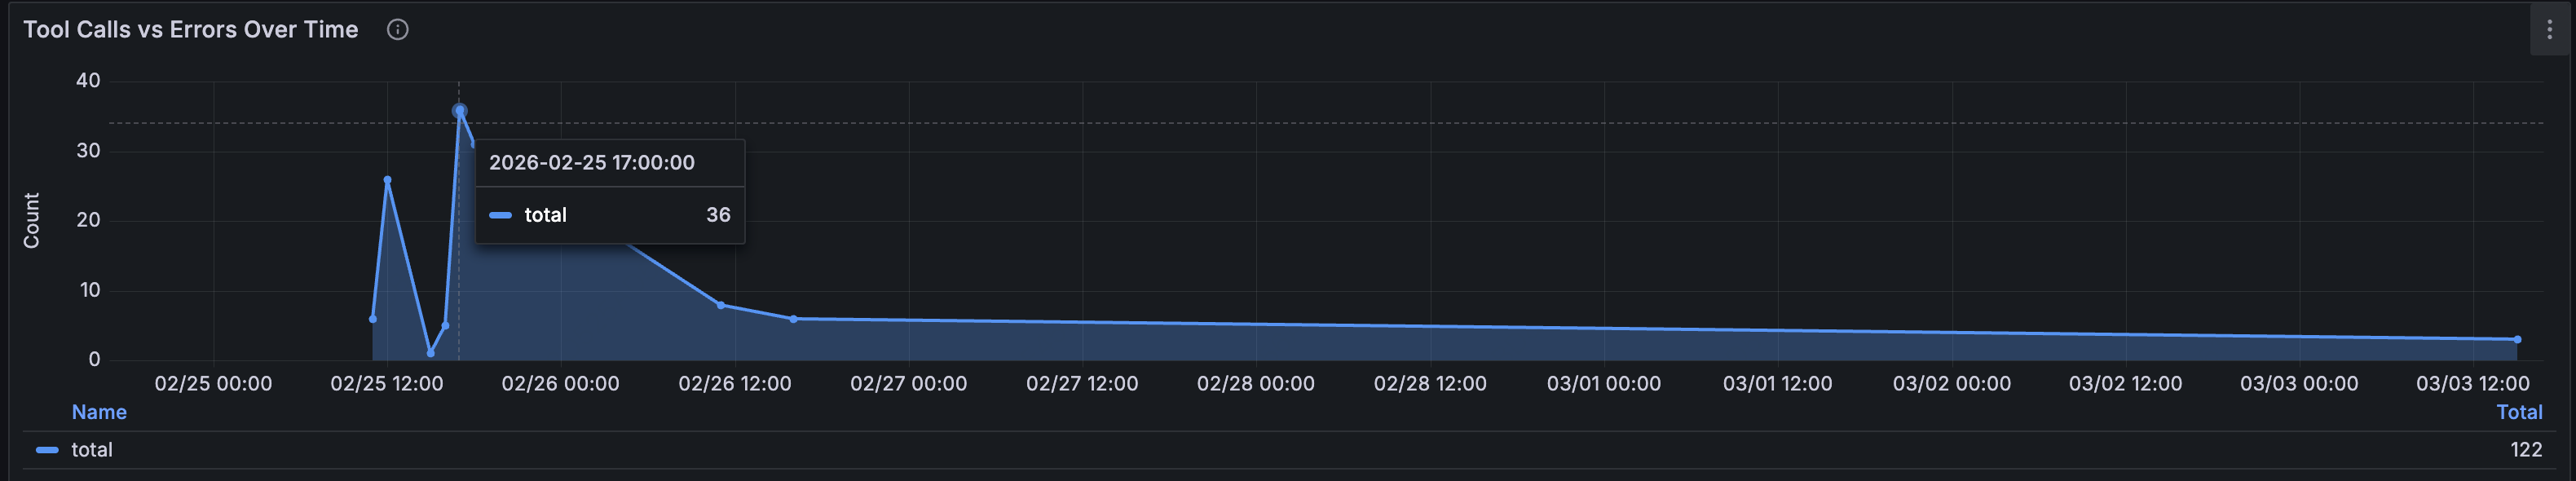
Key finding: This observability dashboard help teams confirm that the Agent was issuing curl requests to external URLs during certain user queries, running commands like rm, and encountering prompt injection markers in returned content, also preventing indirect prompt injection attack chains.
2. Cost Analysis: What Did That Query Actually Cost?
Open the Cost & Efficiency Dashboard for an overview:
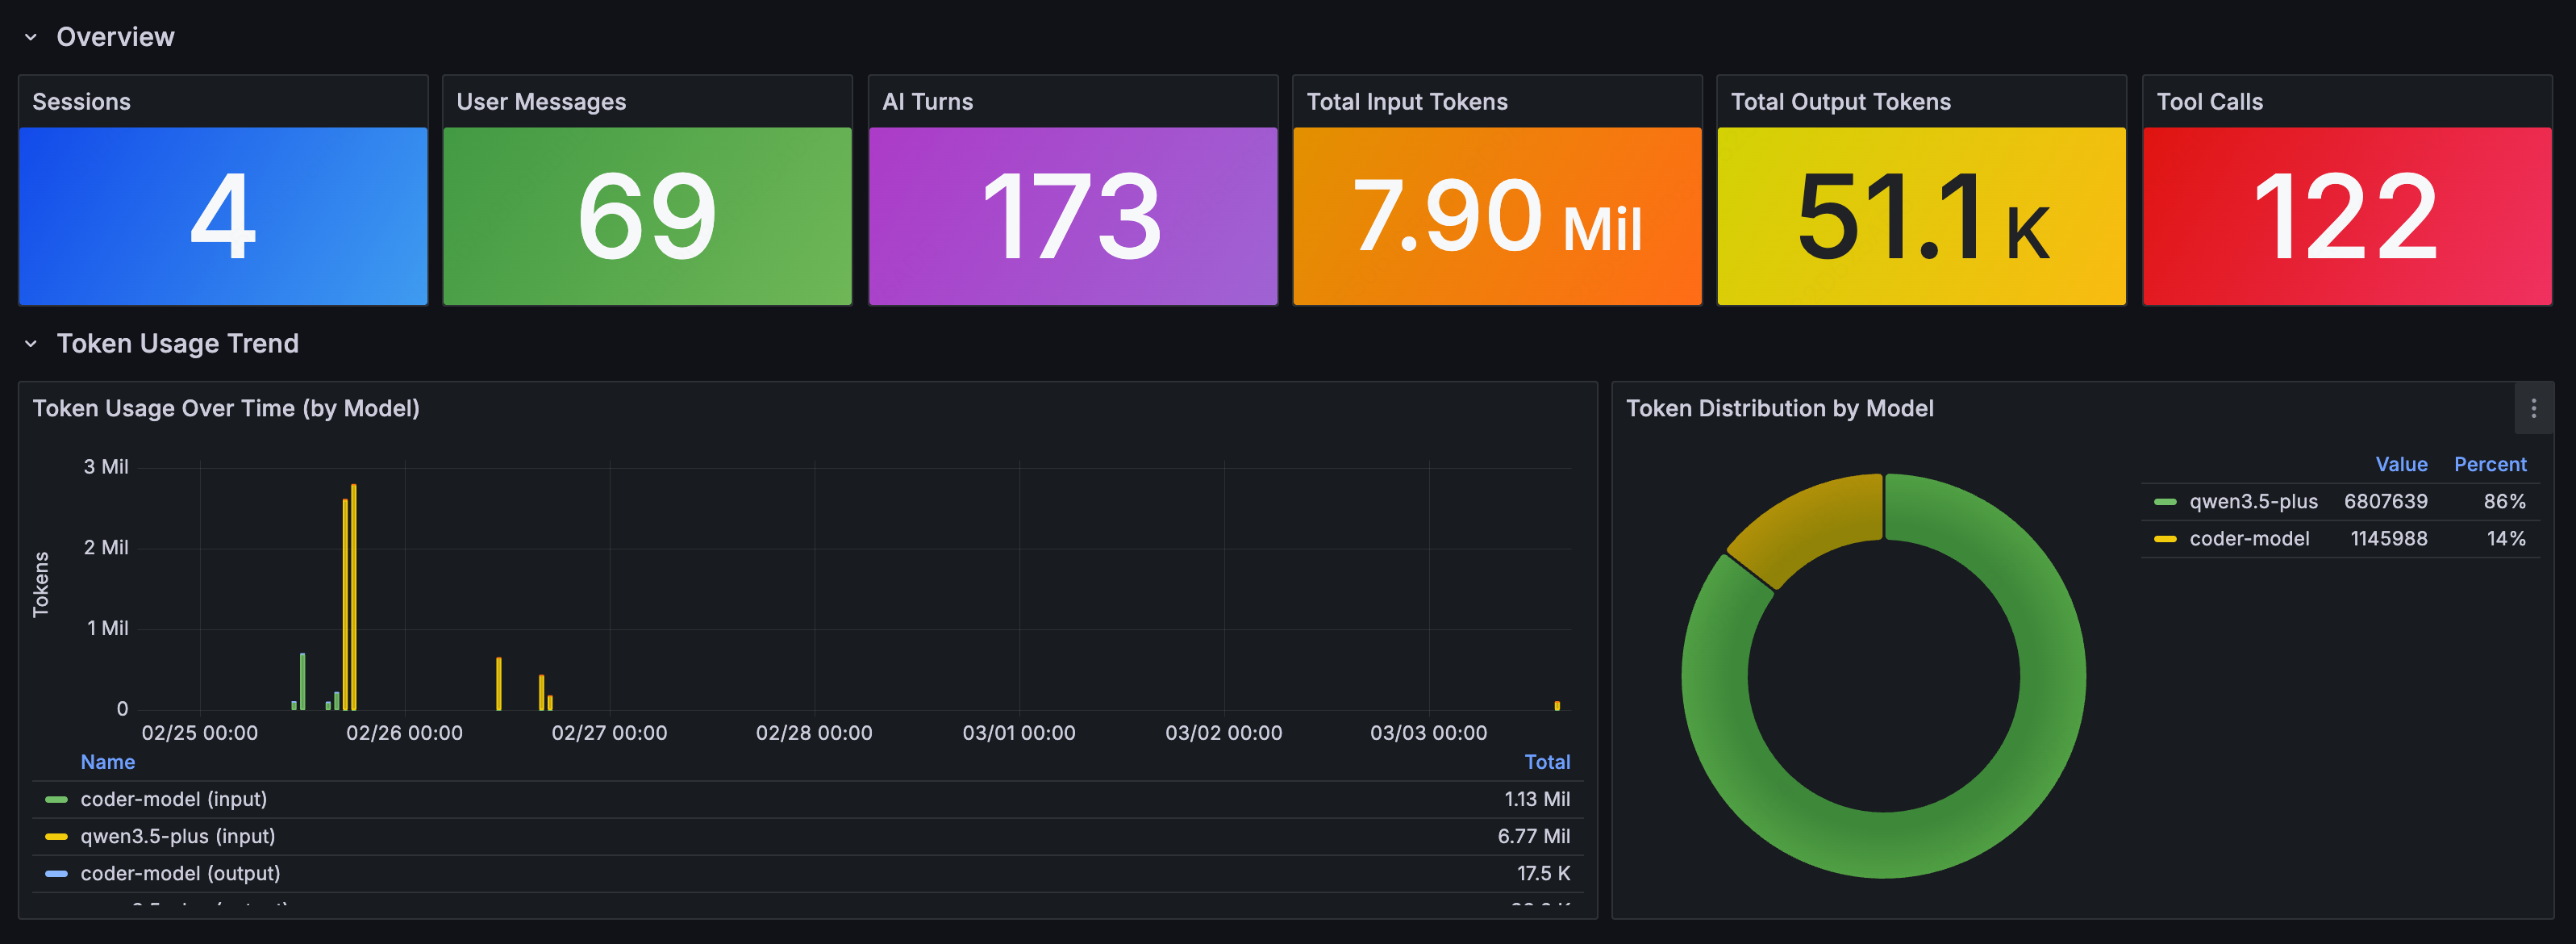
Token Usage Over Time
The time-series chart shows token consumption trends, broken down by models, with input and output tracked separately:
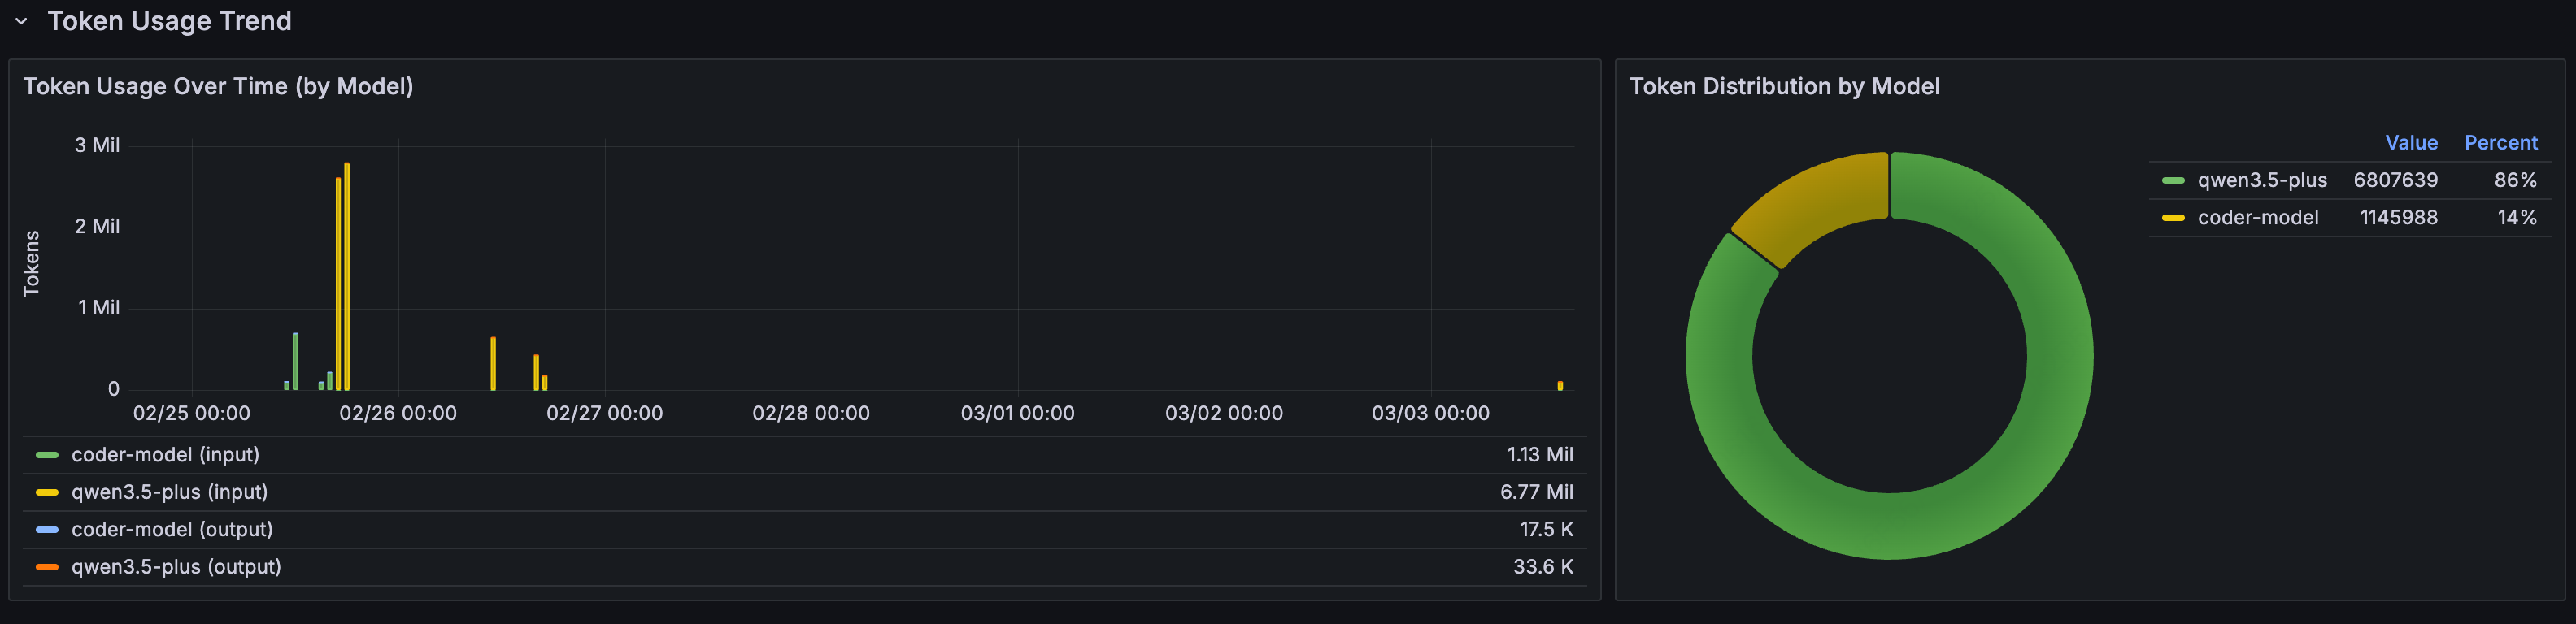
The pie chart on the right shows each model's share of total token consumption, useful for understanding where your costs are actually coming from.
The Context Window Snowball Effect
The most important chart in this dashboard: Input Tokens per Turn (Context Window Growth):
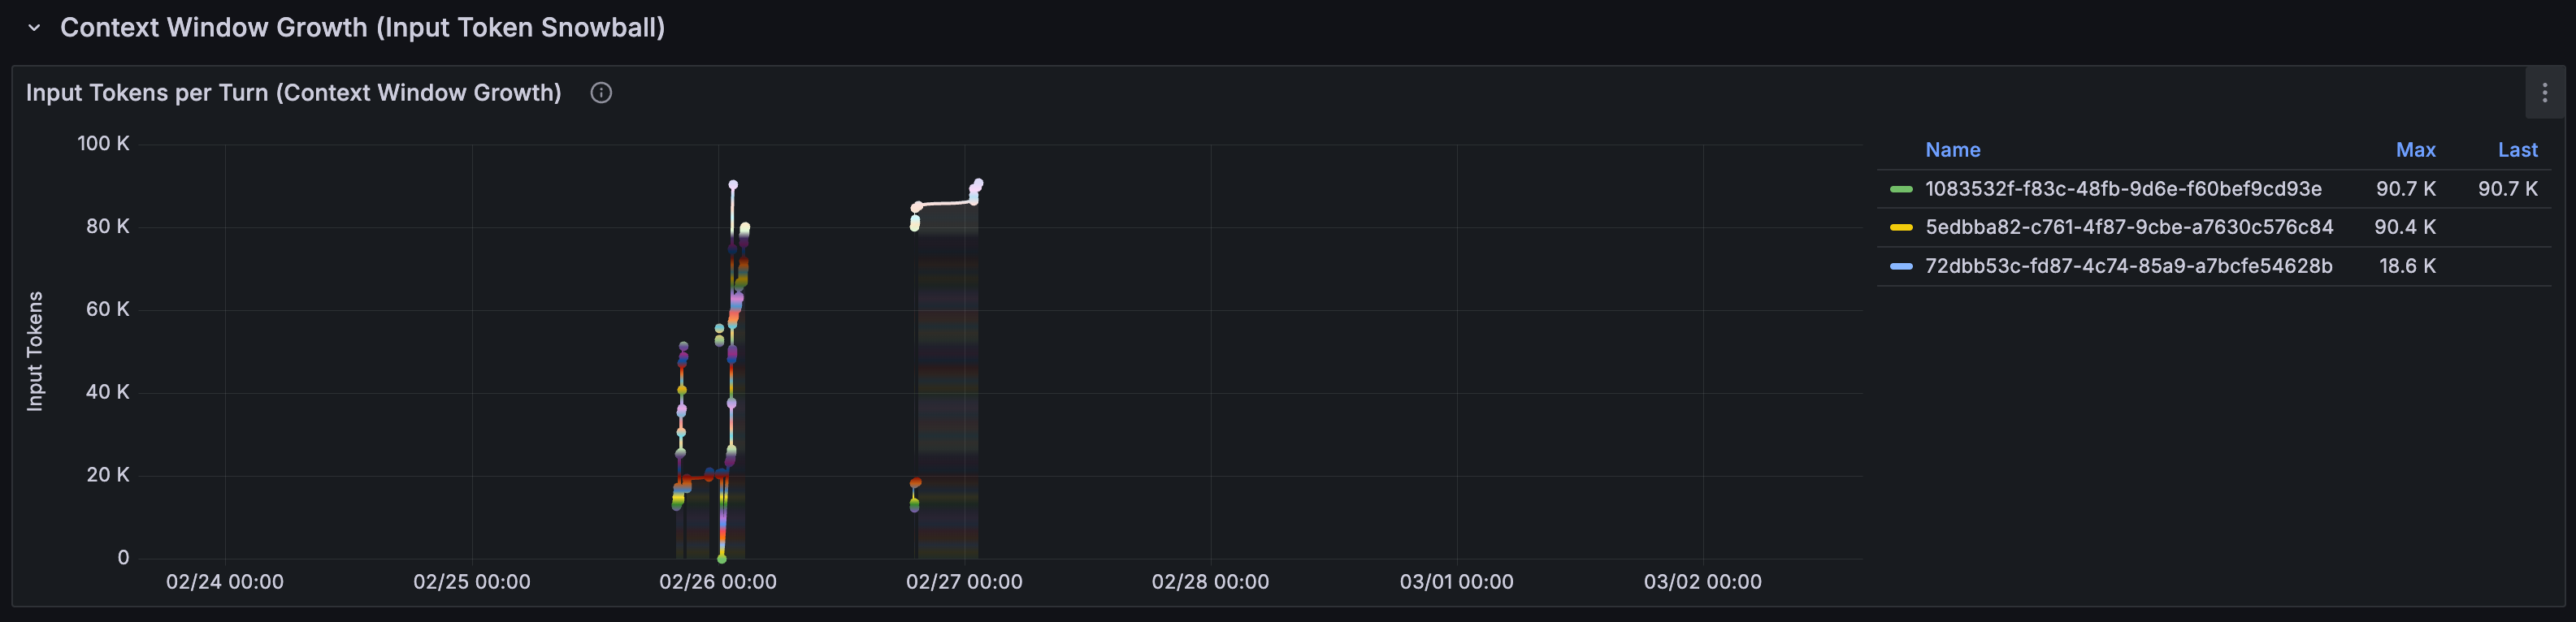
Each line represents one session. The gives a visual image to the snowball effect: as a conversation progresses, the input tokens per LLM call keep growing, because every call carries the full conversation history.
A session that starts at a few thousand tokens can balloon to hundreds of thousands. In our case, a user asks 19 questions, the input cost of question 19 was 100x that of question 1.
Per-Question Cost
This table breaks costs down to the individual question level:
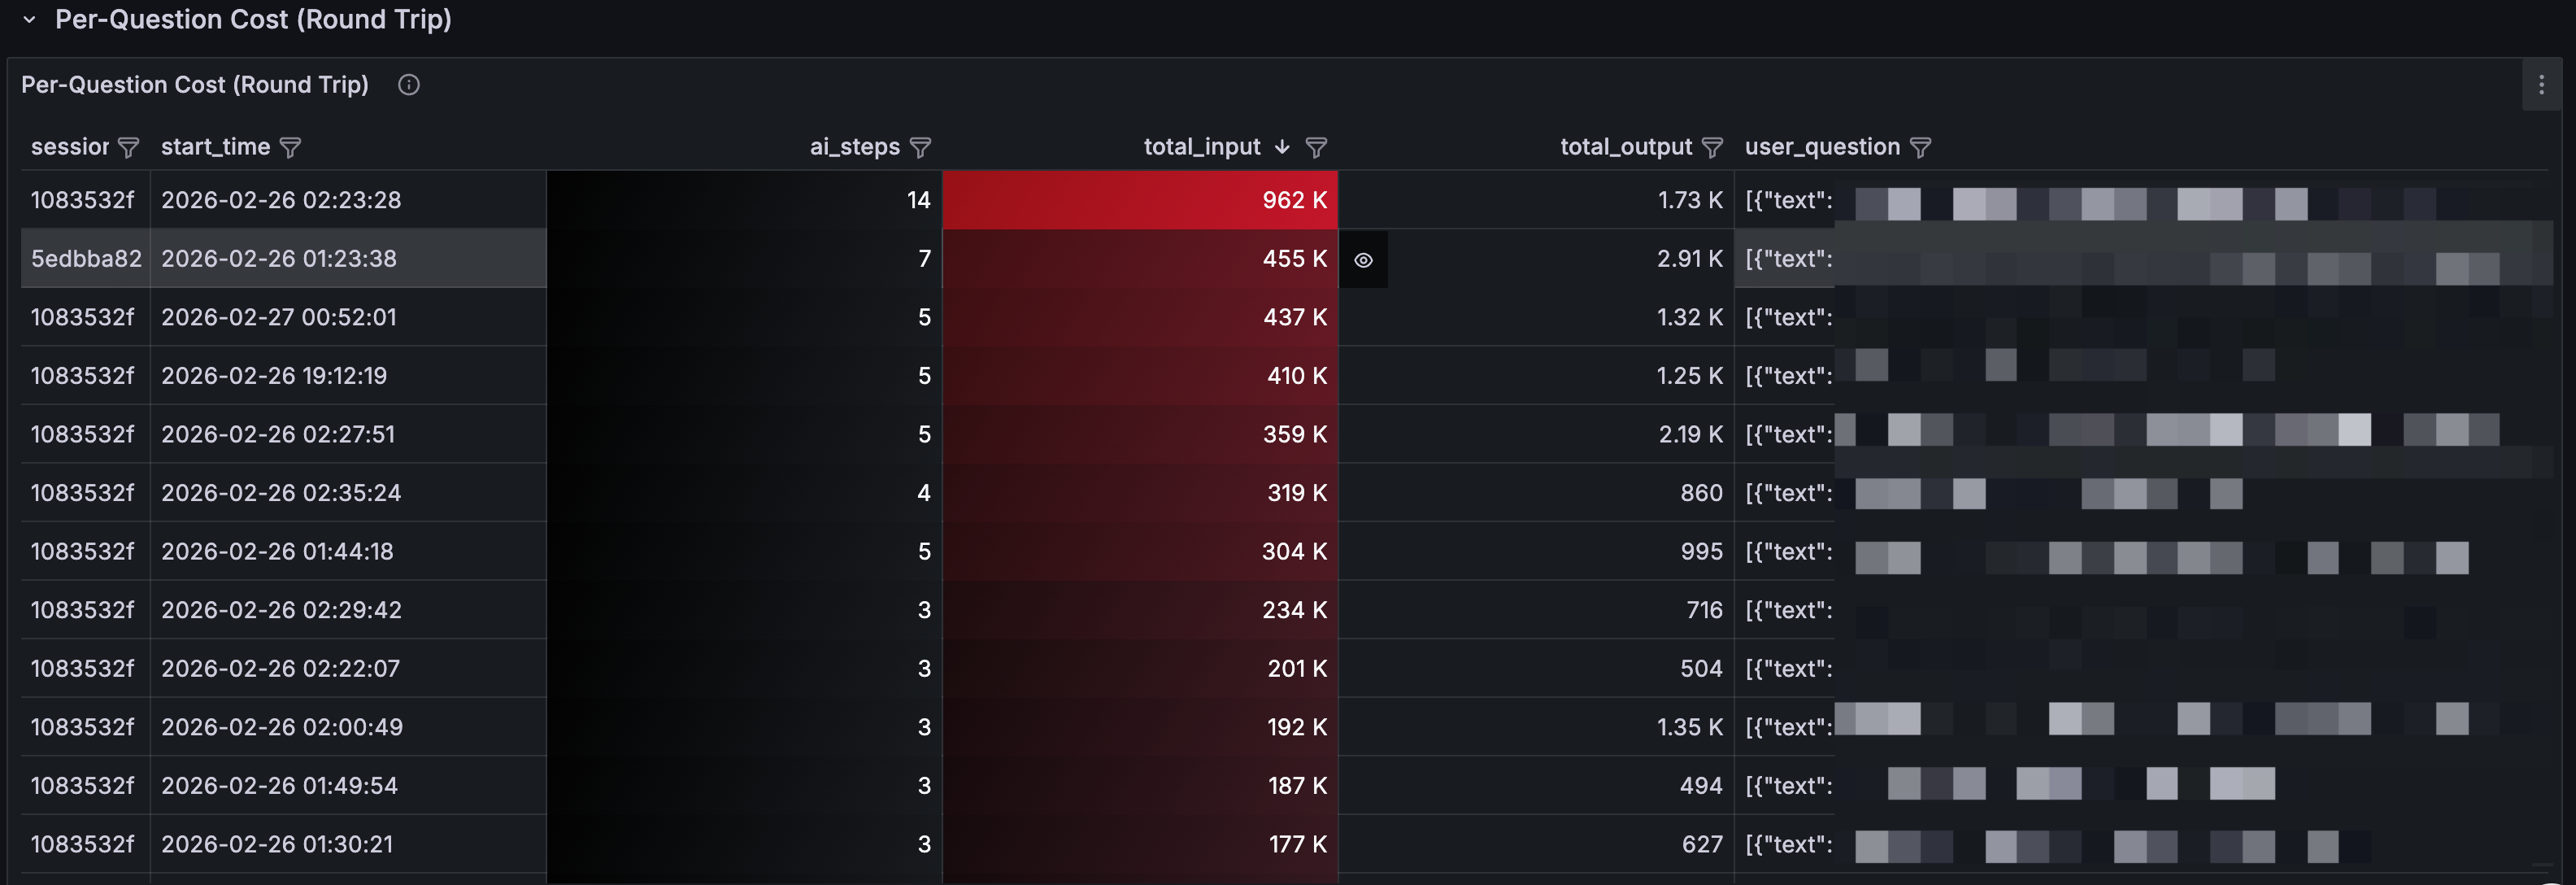
-
ai_steps: how many LLM rounds this question triggered (deeper blue = more rounds)
-
total_input: cumulative input tokens (deeper red = higher cost)
-
user_question: what the user actually asked
What you'll find: some seemingly simple questions like "look up info about this website" can trigger a long Agent chain: search, browse, summarize, confirm. Each step is an LLM call. A single question can easily consume hundreds of thousands of tokens.
3. Behavior Analysis: What Is Your Agent Actually Doing?
The Agent Behavior Dashboard provides a system-wide view
Performance Overview
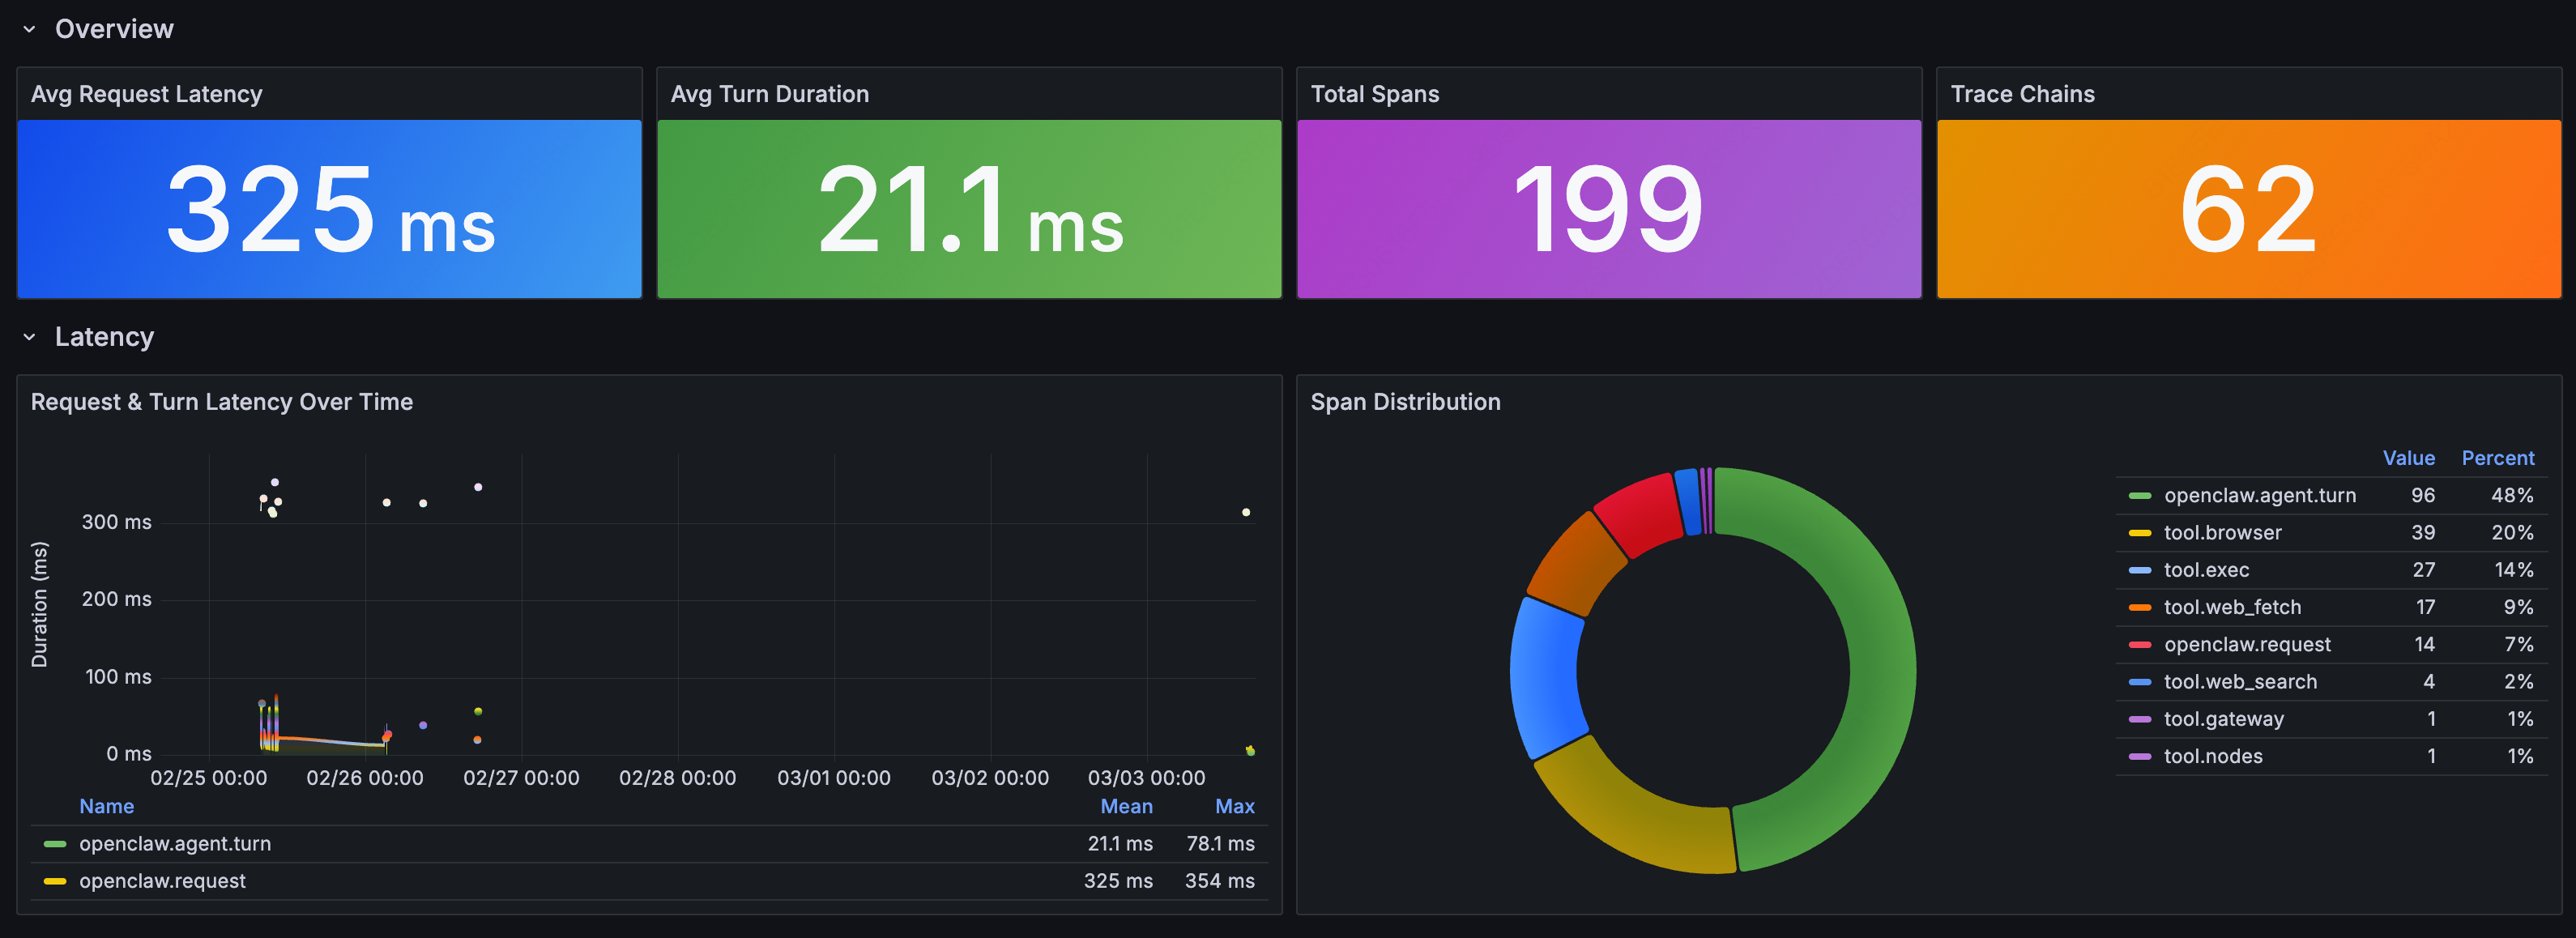
-
Avg Request Latency: average time from user request to Agent response
-
Avg Turn Duration: average time per Agent reasoning round
-
Total Spans: total span count (a proxy for Agent activity volume)
-
Trace Chains: number of trace chains (a proxy for request complexity)
Tool Call Distribution
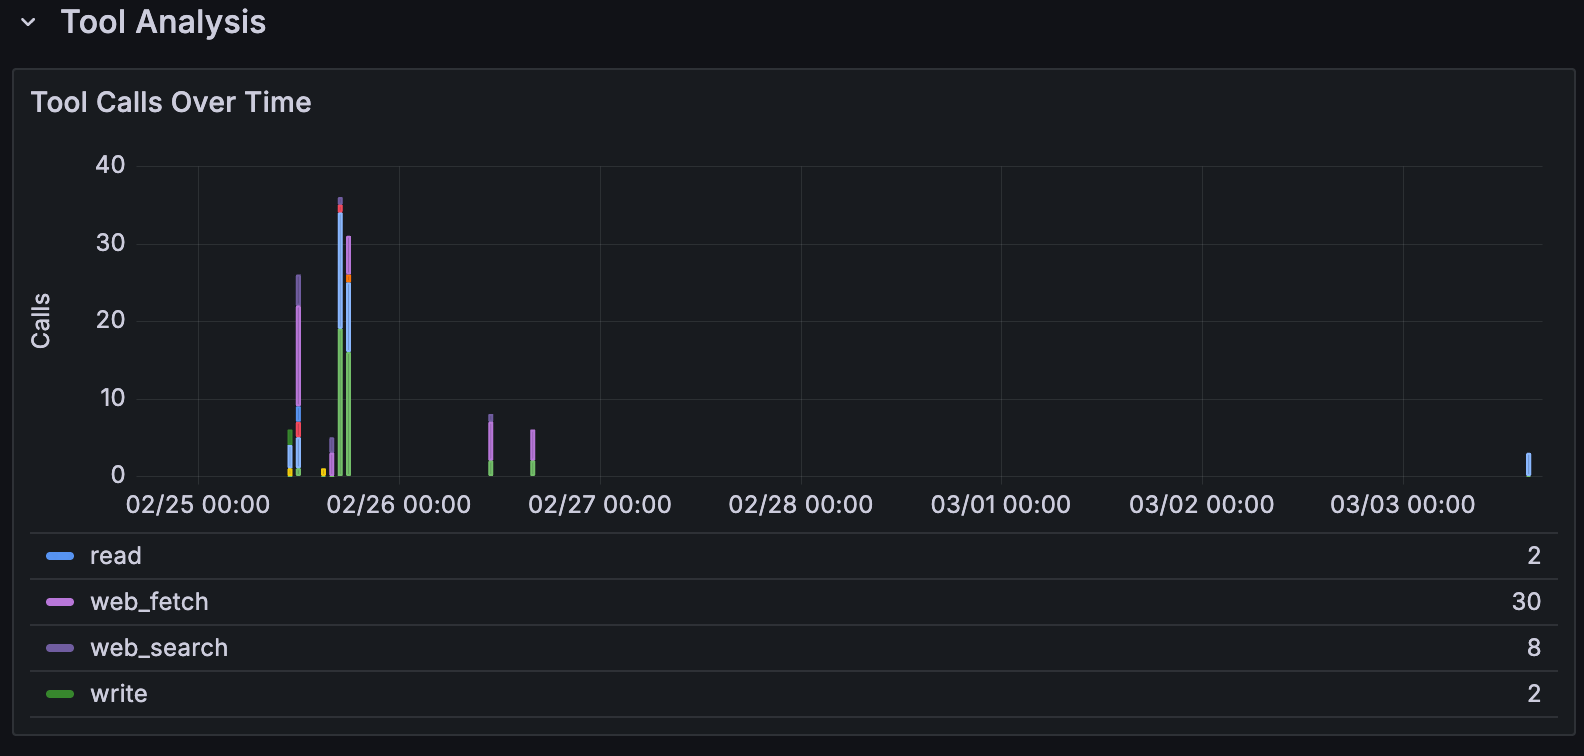
The Tool Call Summary table shows the full picture for each tool:
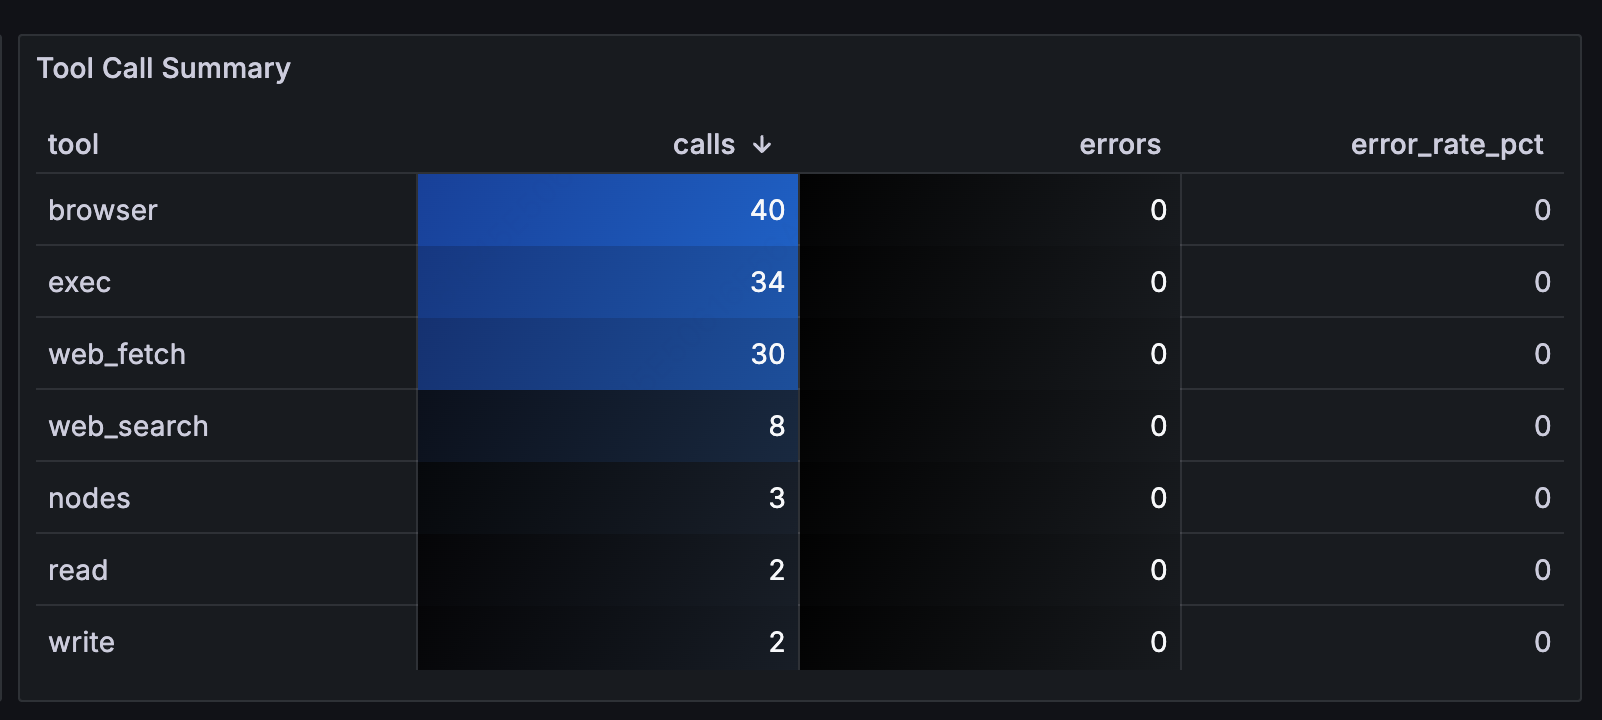
Key findings:
-
browserwas called 40 times**:** the most-used tool in this instance -
execwas called 31 times**:** every invocation warrants review -
web_fetchdominated by call volume, meaning the Agent spent significant time fetching external content
Span Performance Summary
Detailed performance analysis at the Span level:
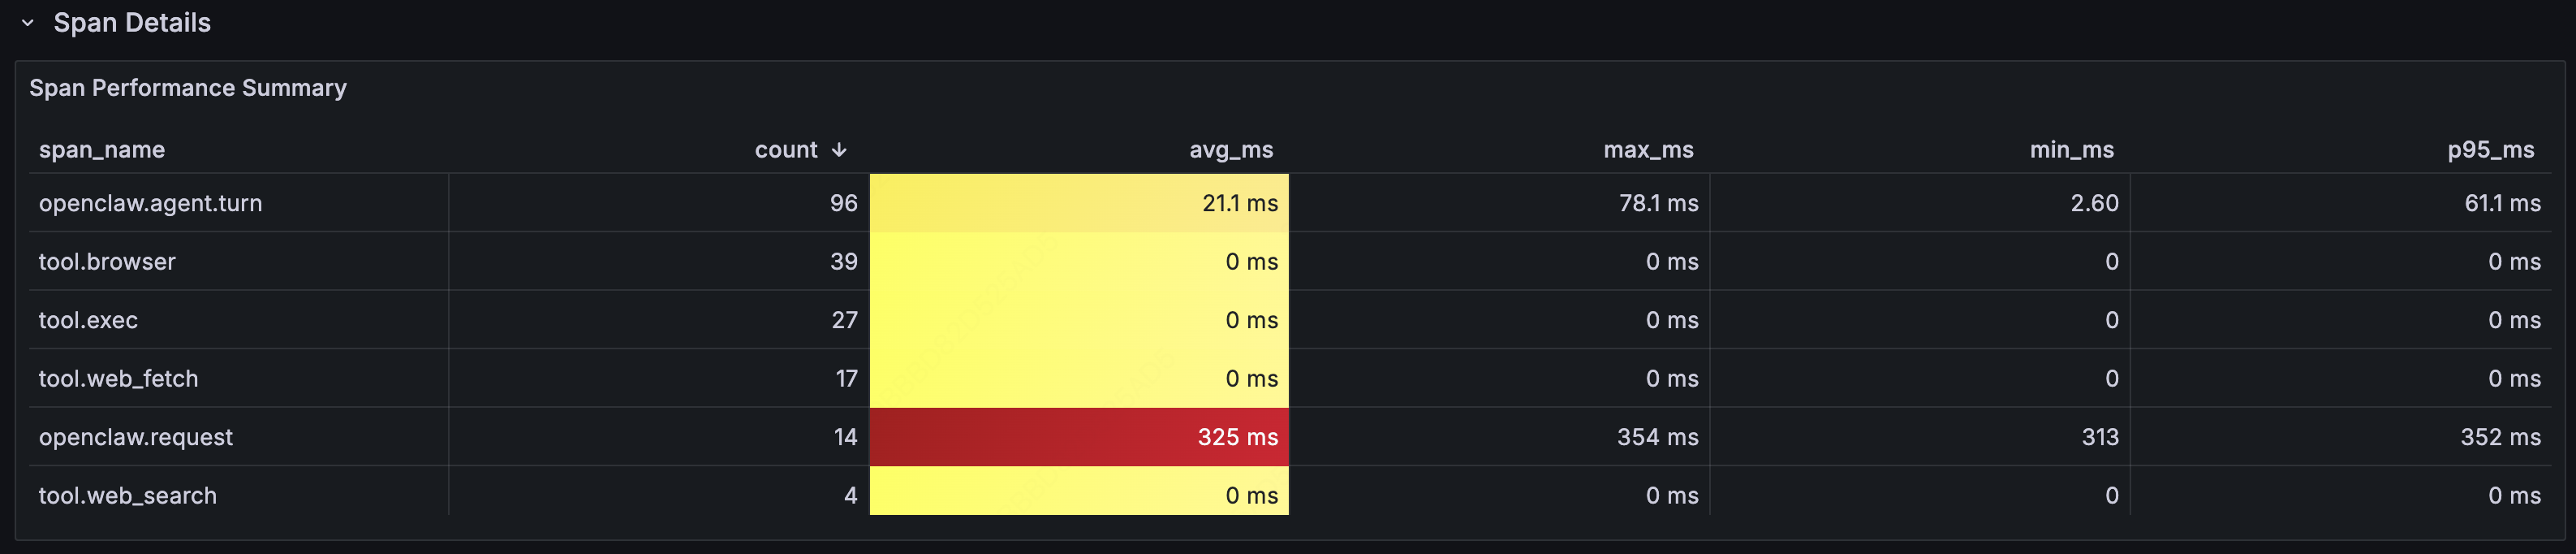
The P95 latency for openclaw.request (end-to-end) was significantly higher than the average, indicating long-tail requests. Trace data lets you pinpoint exactly which tool call or LLM call was the bottleneck.
Conversation Flow
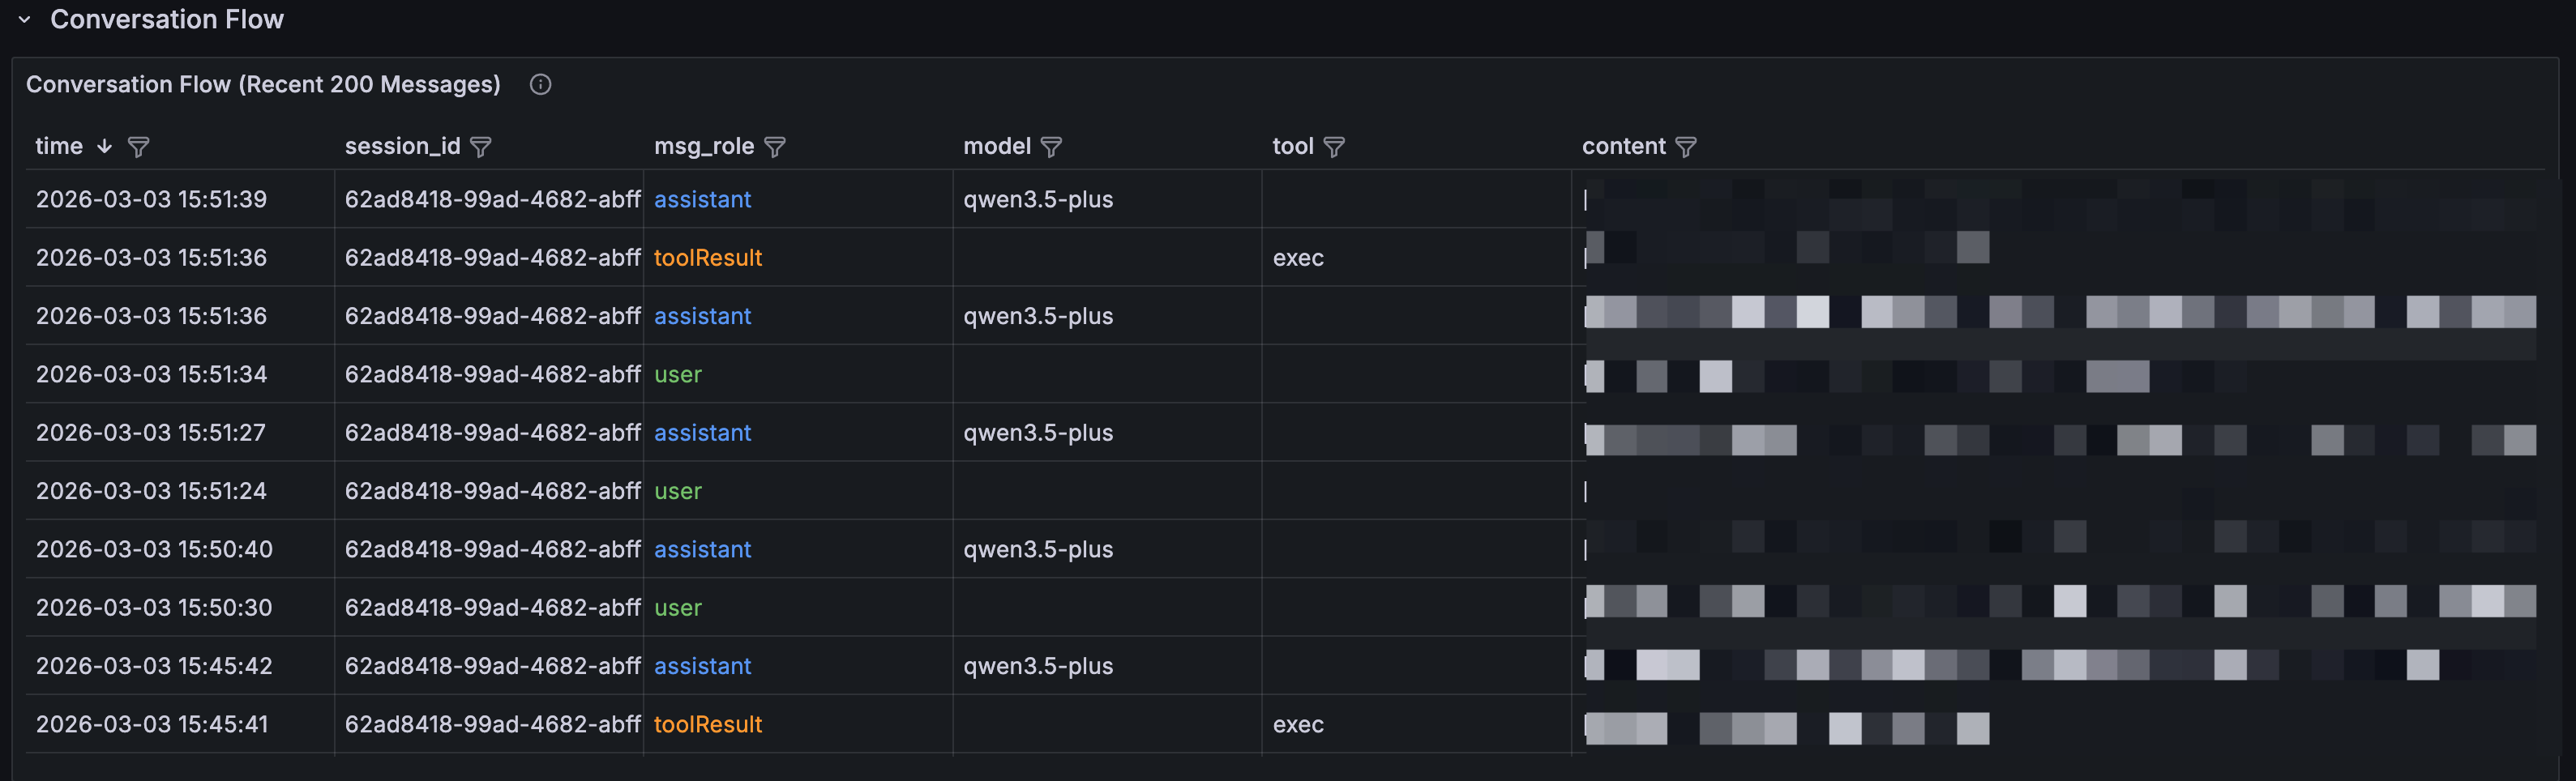
A full conversation log in reverse-chronological order, showing every interaction between the Agent and users. You can trace the complete lifecycle of any request: user input → Agent reasoning → tool call → result → response. msg_role is color-coded: blue for user messages, green for Agent replies, orange for tool returns.
When you spot something unusual in another panel, come to the conversation flow to find the exact conversational context and reconstruct what happened step by step.
4. Log Exploration: Doris App Discover
Dashboards cover the pre-defined views. Real-world debugging usually means going off-script. The Doris App plugin offers a built-in Discover feature, helping customized debugging.
Navigate to Doris App > Discover in Grafana. You'll get an interface similar to Kibana's log explorer:
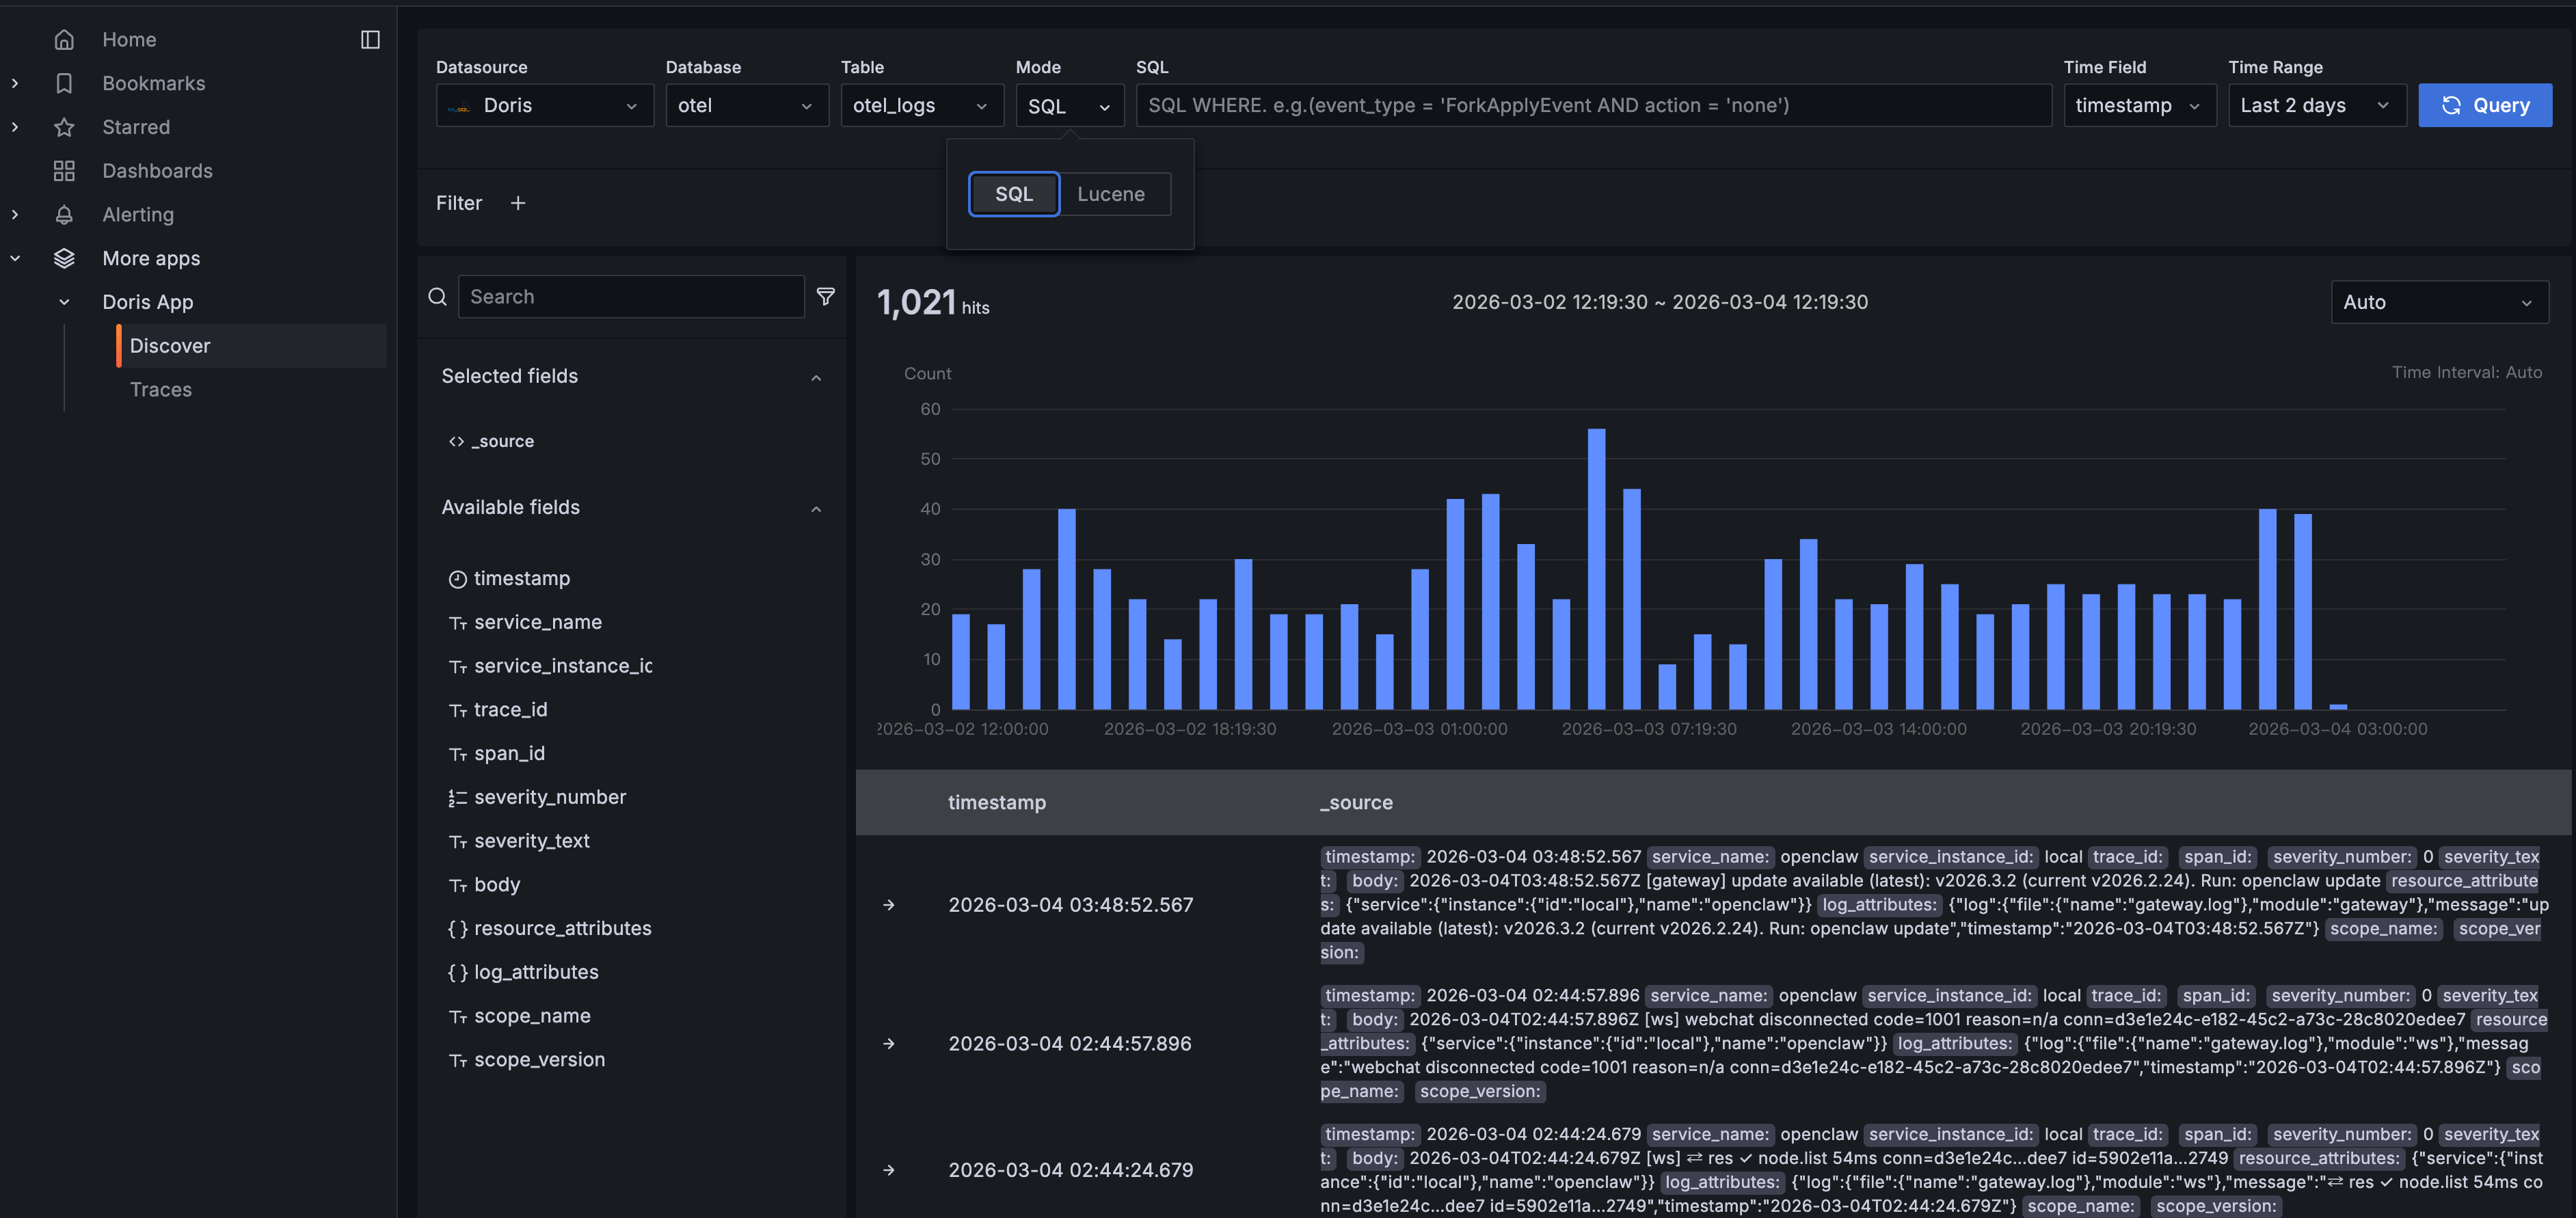
The query bar supports two modes: SQL and Lucene. In SQL mode, write any WHERE clause: for example, log_attributes['type'] = 'message' to filter specifically for Agent conversation messages. Lucene mode gives you full-text search for keyword lookups.
Click to expand any log entry for the full structured detail:
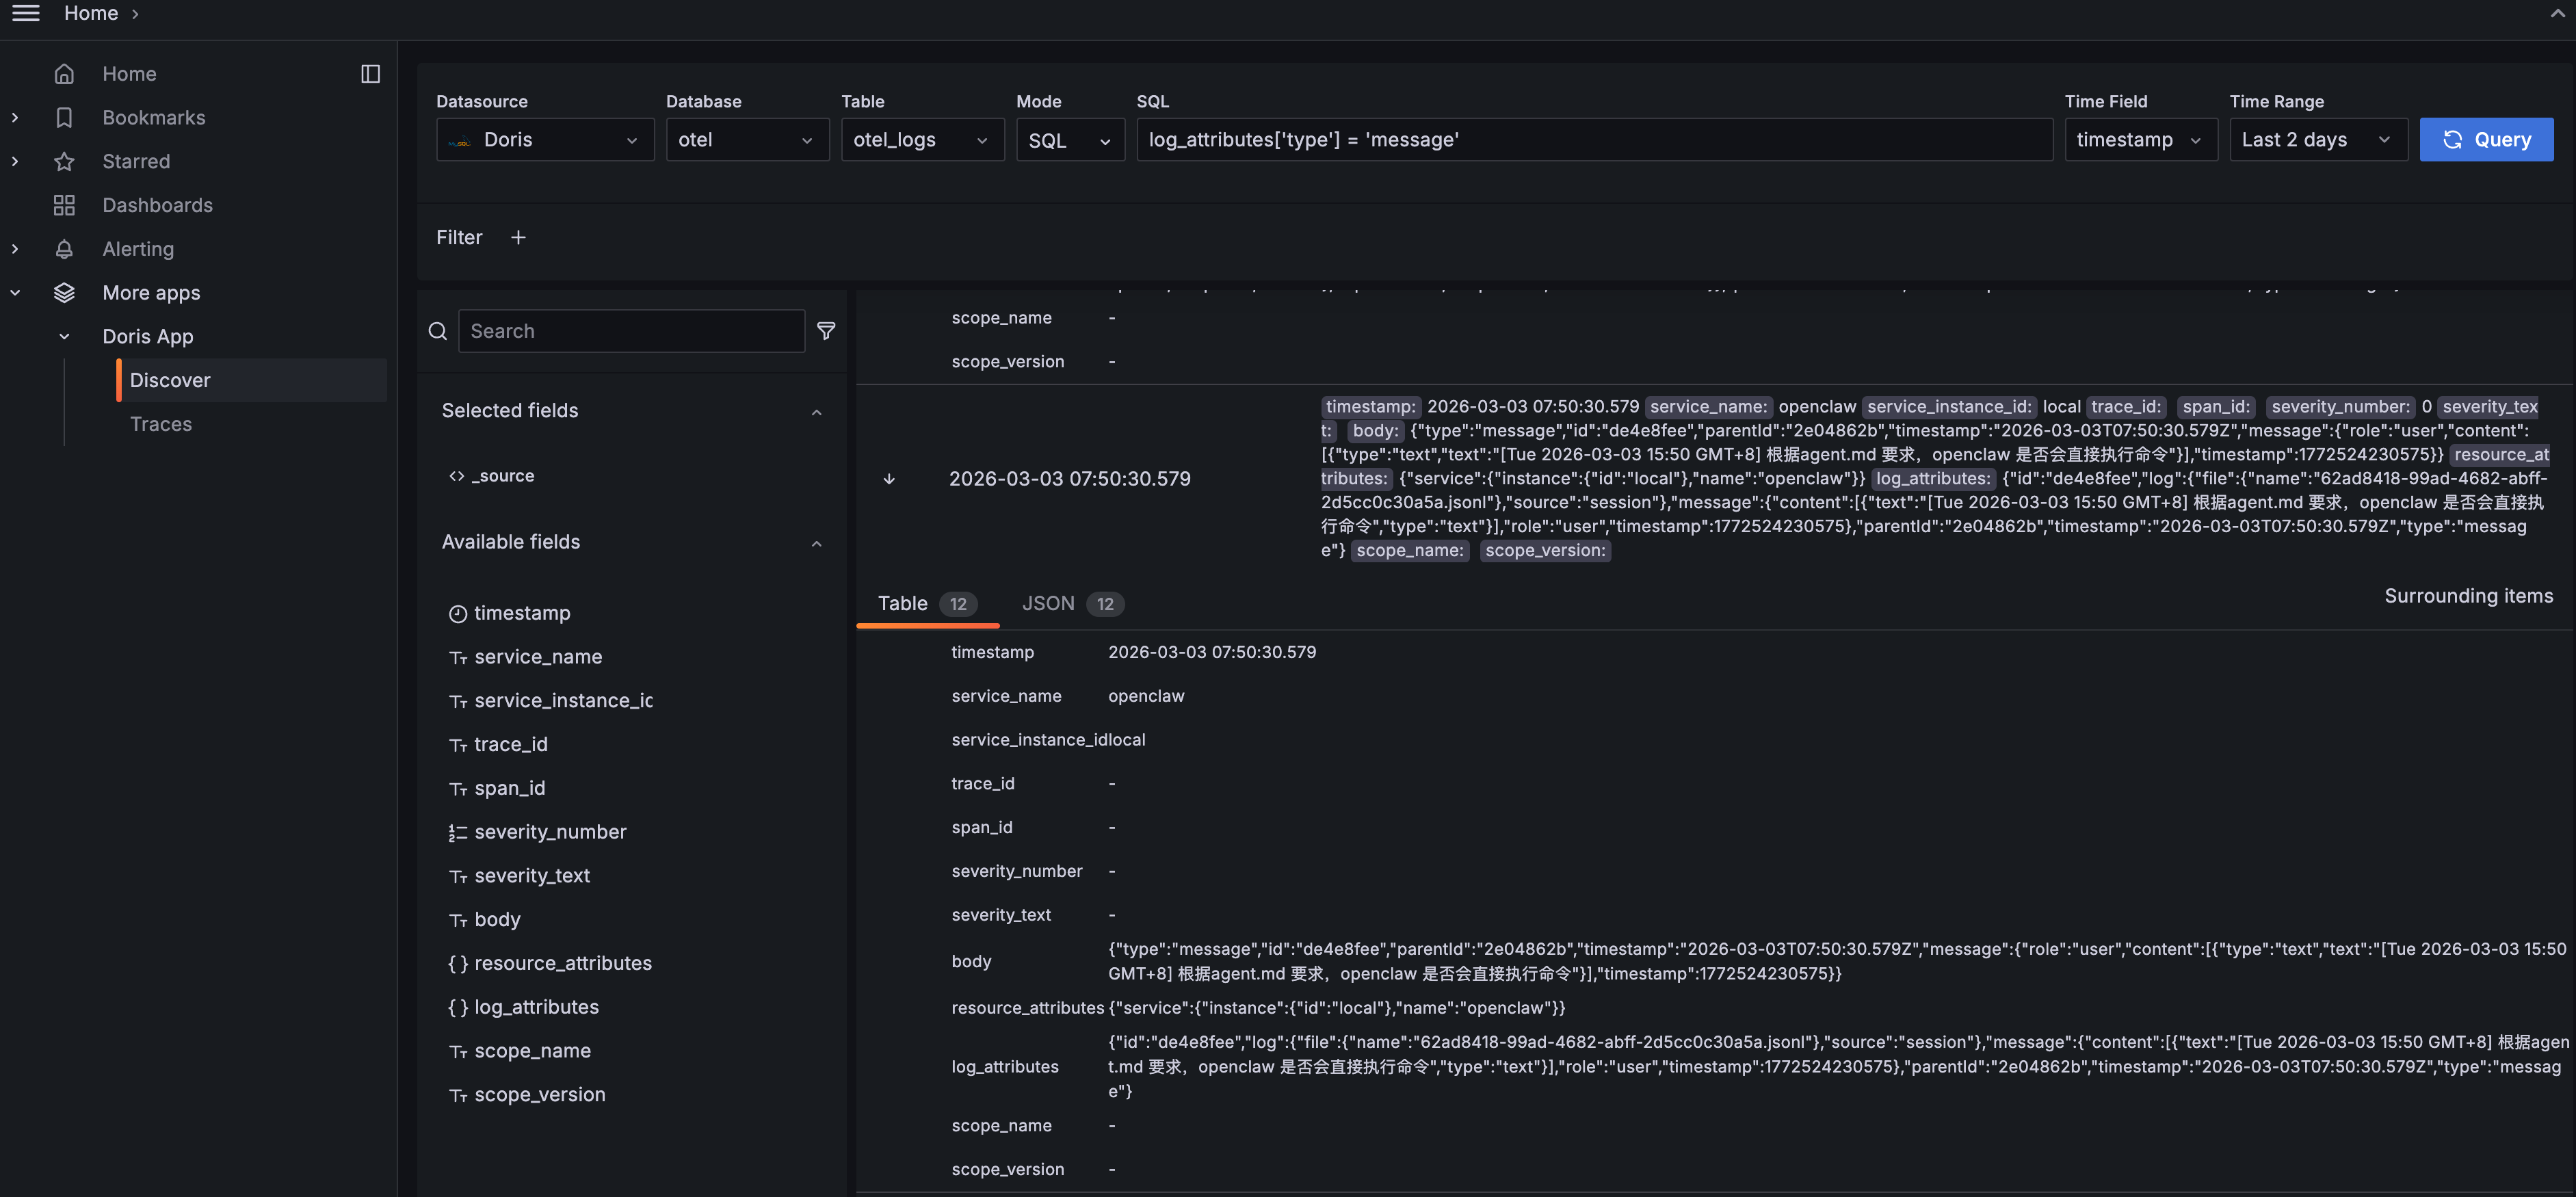
The Table view lists every field clearly. The JSON view shows the raw data structure. You can see the Agent's full message content, including its reasoning process (thinking), the commands it ran, the model it used, and token consumption. "Surrounding items" pulls up neighboring log entries so you can reconstruct the full event timeline.
Discover is most useful for:
-
Ad-hoc queries: analysis that dashboards don't cover, written directly in SQL
-
Keyword search: finding specific error messages, file paths, or command strings
-
Data validation: confirming that telemetry collection is working and fields are formatted as expected
5. Deep Dive: Doris App Trace Analysis
While the three dashboards give you a comprehensive overview, the Trace feature helps you to go deeper into the full call chain of a single request.
Navigate to Doris App > Traces in Grafana:
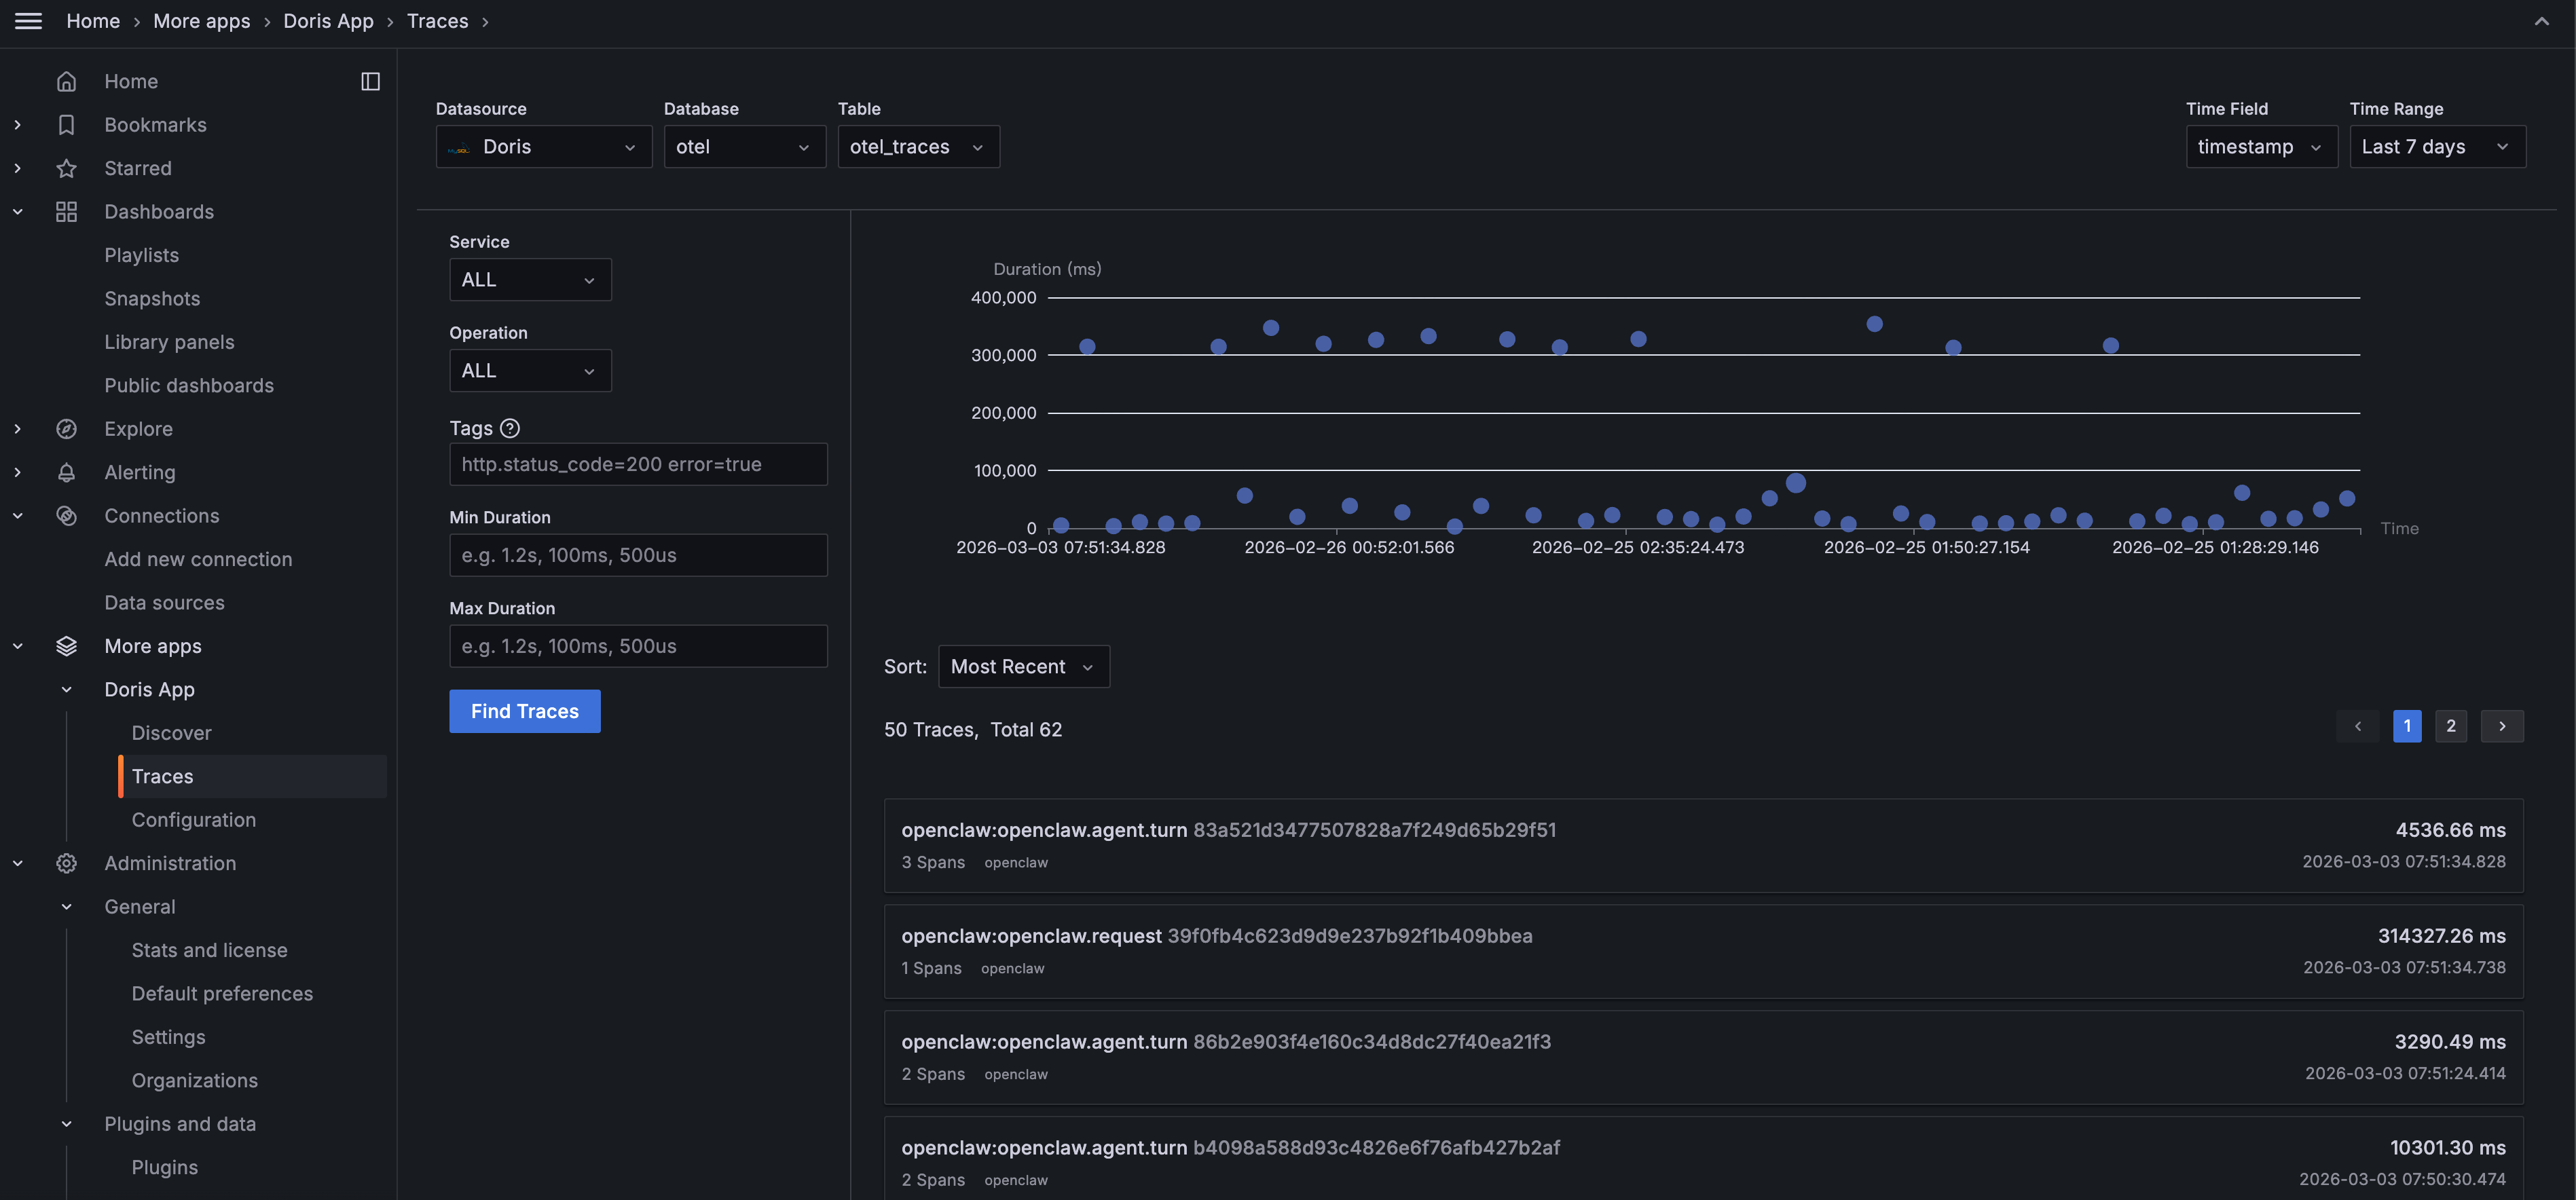
Filter by Service or Operation, search by tags (e.g., http.status_code=200 error=true), or filter by Duration to surface slow requests. The scatter plot gives an overview of each trace's latency. The dots well above the average line are the ones to investigate.
Click any trace to open the Waterfall view:
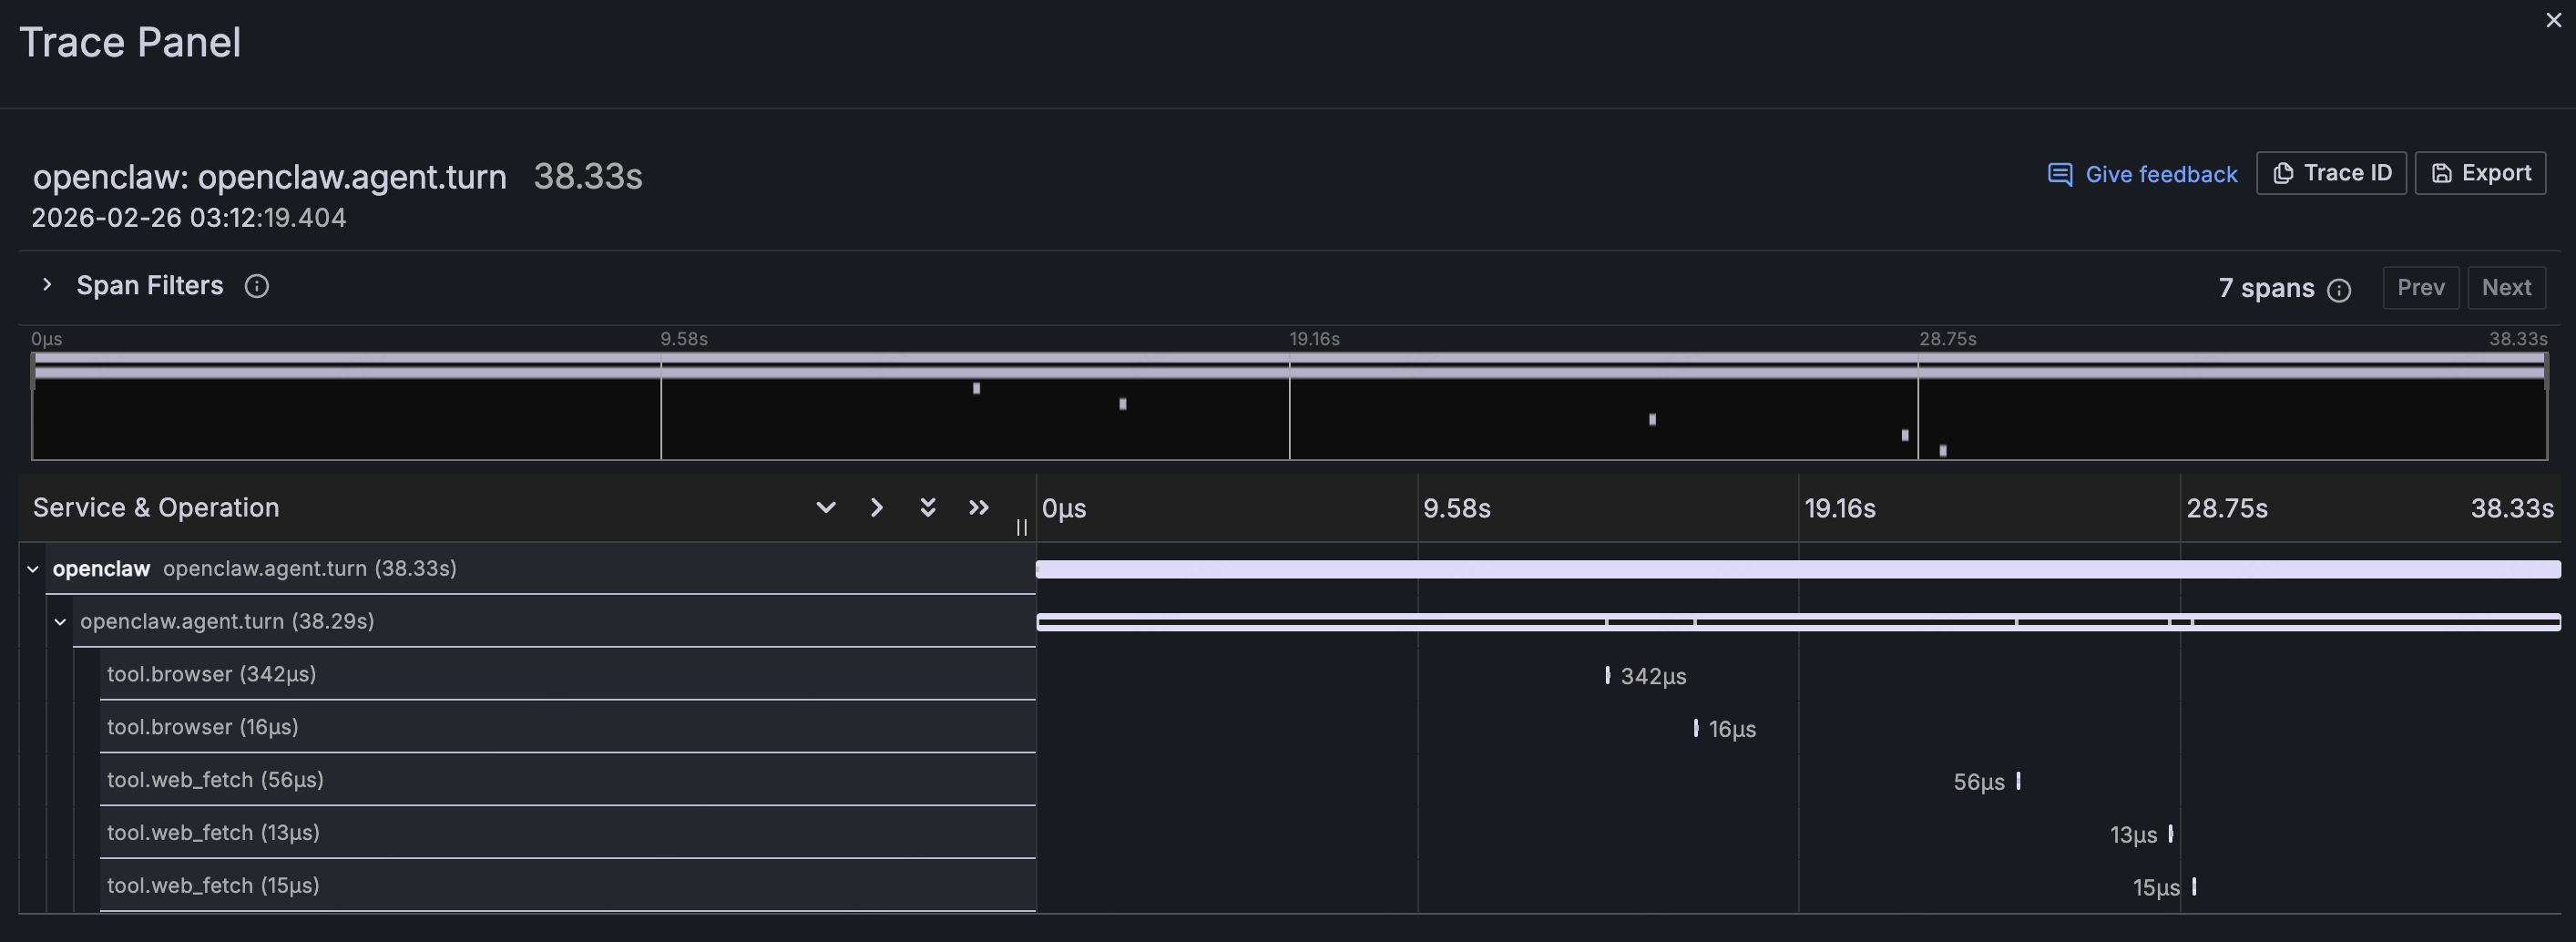
This expands the full lifecycle of an Agent request into a call chain: openclaw.agent.turn is the parent Span, taking 38.33 seconds total. Child Spans like tool.browser and tool.web_fetch show which tools were called, in sequence, and how long each took.
Trace analysis is most valuable for:
-
Slow request investigation: When a user says "the AI is too slow", Trace tells you whether the bottleneck is LLM inference or a specific tool call hanging
-
Security forensics: When a suspicious operation surfaces in the security audit, use the Trace ID to reconstruct the full call context
-
Understanding Agent reasoning: See directly how the Agent thinks: what it called first, what it called next, and why the total time was what it was
Dashboards tell you something's wrong. Traces tell you exactly where.
Try it yourself with the demo below: Deploy AI Observe Stack in 5 Minutes
Step 1: Start AI Observe Stack
git clone https://github.com/ai-observe/ai-observe-stack.git
cd ai-observe-stack/docker
docker compose up -d
Wait for Doris to be ready (first run takes ~3 minutes):
docker compose ps
# All services should show STATUS "running", with doris showing "(healthy)"
Note: For production deployments, you can replace the local Doris instance with VeloDB Cloud. See "Production: Connect to VeloDB Cloud" below.
Step 2: Connect Your Agent
Using OpenClaw as the example: install the community OTel plugin and configure the OpenTelemetry endpoint:
# Install the plugin
mkdir -p ~/.openclaw/plugins
cd ~/.openclaw/plugins
git clone https://github.com/henrikrexed/openclaw-observability-plugin otel-observability
cd otel-observability && npm install
In ~/.openclaw/openclaw.json:
{
  "plugins": {
    "load": {
      "paths": ["~/.openclaw/plugins/otel-observability"]
    },
    "entries": {
      "otel-observability": {
        "enabled": true,
        "config": {
          "endpoint": "http://127.0.0.1:4318",
          "protocol": "http",
          "serviceName": "openclaw",
          "traces": true,
          "metrics": true
        }
      }
    }
  }
}
Start log collection. (The community plugin doesn't export logs natively, so we use filelog collection instead. Run this command from the ai-observe-stack/docker directory you cloned in Step 1. $(pwd) needs to resolve to that path.)
docker run -d \
  --name openclaw-log-collector \
  --network docker_aiobs-net \
  -v ~/.openclaw/logs:/openclaw-logs:ro \
  -v ~/.openclaw/agents:/openclaw-agents:ro \
  -v $(pwd)/../examples/openclaw/otel-collector-log-config.yaml:/etc/otelcol-contrib/config.yaml:ro \
  otel/opentelemetry-collector-contrib:0.144.0 \
  --config=/etc/otelcol-contrib/config.yaml
Restart OpenClaw:
openclaw gateway restart
Step 3: Open the Dashboards
Open Grafana at http://localhost:3000 (default credentials: admin / admin). The three OpenClaw dashboards are pre-loaded. No need for manual import:
-
Security & Audit Dashboard
-
Cost & Efficiency Dashboard
-
Agent Behavior Dashboard
Start using OpenClaw. The dashboards populate automatically as data comes in. Everything your Agent does is now visible.
Production: Connect to VeloDB Cloud
The default setup includes a bundled Apache Doris instance, suitable for local testing and development. If your Agent is running in production, use VeloDB Cloud as the AI Observe Stack backend for a fully managed, zero-ops experience.
Replace Step 1 with the following, and everything else stays the same:
# 1. Configure connection details
cp .env.example .env
# Edit .env with your VeloDB Cloud connection info:
DORIS_FE_HTTP_ENDPOINT=http://<your-cluster>.velodb.io:http_port
DORIS_FE_MYSQL_ENDPOINT=<your-cluster>.velodb.io:mysql_port
DORIS_USERNAME=admin
DORIS_PASSWORD=<your-password>

# 2. Start in without-doris mode (skip local Doris; data writes directly to the cloud)
docker compose -f docker-compose-without-doris.yaml up -d
Beyond OpenClaw
OpenClaw is just one agent platform. AI Observe Stack is built to be general-purpose.
Any AI Agent framework that supports OpenTelemetry can use the observability stack:
-
Data ingestion: send Traces and Metrics via the OpenTelemetry protocol (gRPC :4317 / HTTP :4318). Collect logs via the filelog receiver
-
Data storage: Apache Doris's columnar storage engine, with VARIANT type purpose-built for semi-structured observability data and inverted indexes that accelerate text search
-
Data analysis: standard SQL; write any query you need, no proprietary query language to learn
Whether you're running LangChain, AutoGen, CrewAI, or a custom-built Agent framework, if it outputs OpenTelemetry telemetry, it works with this stack.
Join the Apache Doris community on Slack and connect with Doris experts and users. If you're looking for a fully managed Apache Doris cloud service, contact the VeloDB team.