Are you facing a similar "Observability Tax" problem as this engineer on Reddit? If so, this article can solve the challenge you are facing.
Our observability costs are now higher than our AWS bill
"We have three observability tools. datadog for metrics and apm. splunk for logs. sentry for errors.
Looked at the bill last month. $47k for datadog. $38k for splunk. $12k for sentry. our actual aws infrastructure costs $52k.
We're spending more money watching our systems than running them. that's insane.
..."
The "Observability Tax"
As the redditor above experienced, the tax on observing a system could be significant where it may even exceed the business system it monitors
- Commercial observability products such as Datadog and Splunk use proprietary format storage and query analysis interfaces. They are complex and costly to migrate to other systems, so it is very easy to be locked into the high rates.
- Essential data, such as log, trace, and metrics for observability, are scattered across multiple systems, requiring different tools to access, leading to difficulties when trying to aggregate relevant information for root cause analysis.
To avoid the ongoing "Observability Tax", more and more engineers and businesses are turning to open, high-performance observability solutions.
Open Observability Solution: OpenTelemetry + Grafana + VeloDB
The adoption of open observability, based on the open-source community, is growing and evolving. Two standout tools are OpenTelemetry and Grafana.
OpenTelemetry
OpenTelemetry stands out as one of the de facto standards for telemetry data collection such as log, trace, metrics, etc. It defines a series of observability specifications, provides a multi-language telemetry data collection SDK out of the box, and writes telemetry data to the storage backend.
OpenTelemetry is an open source project of the CNCF Foundation, driven by the community rather than commercial companies. In recent years, it has been widely adopted, including open source projects such as Apache Doris, Jaeger, etc. Many commercial products such as Datadog have also begun to support the OpenTelemetry specification.
Grafana
Grafana has become the preferred choice for visualizing observability data. Grafana can visualize and interactively analyze data from different data sources. Grafana supports a wide range of data sources, including Prometheus, Elasticsearch, MySQL, etc. Grafana is an open-source project of Grafana Labs, attracting over 2500 developers worldwide, allowing the development of custom data sources and visualization plugins.
The storage challenge
OpenTelemetry and Grafana have solved the challenges of observability data collection and visualization, but trade off between performance expensive storage backends remain a challenge. If users want good search performance, databases such as ElasticSearch with inverted index provide excellent search performance, but the storage cost of indexes and the computational cost of building indexes are high. On the other hand, indexless architecture represented by Loki reduces storage costs, but search performance suffers.
VeloDB provides both storage cost efficiency and performance
VeloDB is a real-time analytics and search database and one of its major usecases is observability. VeloDB solves this problem well through architectural innovation and continuous engineering optimization, providing inverted index and log retrieval performance comparable to Elasticsearch while significantly reducing CPU and storage costs by 80% or more through better compression and minimizing duplicate data (i.e only columnar storage).
VeloDB has also been deeply integrated with OpenTelemetry and Grafana. VeloDB is an official vendor of OpenTelemetry, and the built-in doris exporter of OpenTelemetry can write data to VeloDB. Grafana can access MySQL-compatible VeloDB through MySQL data sources.
VeloDB contributes the kernel to Apache Doris open source projects and maintains compatibility with Apache Doris. Users can freely choose and switch between free open source software and easy-to-use commercial products. Users who use OpenTelemetry + Grafana + VeloDB do not have to worry about vendor lock-in.
If you want to quickly experience VOG Stack (OpenTelemetry + Grafana + VeloDB), please see the demo below.
Closer look at how VeloDB solves for cost efficiency while maintaining performance
The main cost for observability storage and analysis can be broken into two parts: data storage and data ingestion.
Optimizing the computational cost of writing
VeloDB fully utilizes modern CPU SIMD instructions to accelerate data writing and index construction. It adopts a storage-computation separation architecture that only requires one write at the computing layer, avoiding the consumption of multiple CPU resources for multiple copy writes. The timeseries compaction strategy for observability data is designed and implemented to reduce the additional consumption of background data merging from 3-5 times to 1 time, ultimately achieving an 80% reduction in computing resources and costs compared to Elasticsearch.
Minimizing storage cost
VeloDB reduces storage space usage by using technologies such as columnar storage, simplified inverted index, and ZSTD high compression ratio compression algorithm, while retaining inverted index, reducing storage space to 20% of Elasticsearch. On the other hand, it reduces the unit price of storage space because observability data has obvious hot and cold characteristics.
In most cases, only 10% of the data from the past few days is queried. Therefore, 90% of historical data can be stored on low-priced storage media such as object storage, and only 10% of hot data can be stored on high-speed SSD cache, reducing the overall storage space unit price by at least half. The storage space is reduced to 20% and the unit space cost is reduced to 50%. The overall storage cost is reduced to 10% of Elasticsearch, which is a staggering difference of an order of magnitude. Unlike non-indexed architectures like Loki, this is achieved without losing the inverted index used for query acceleration.

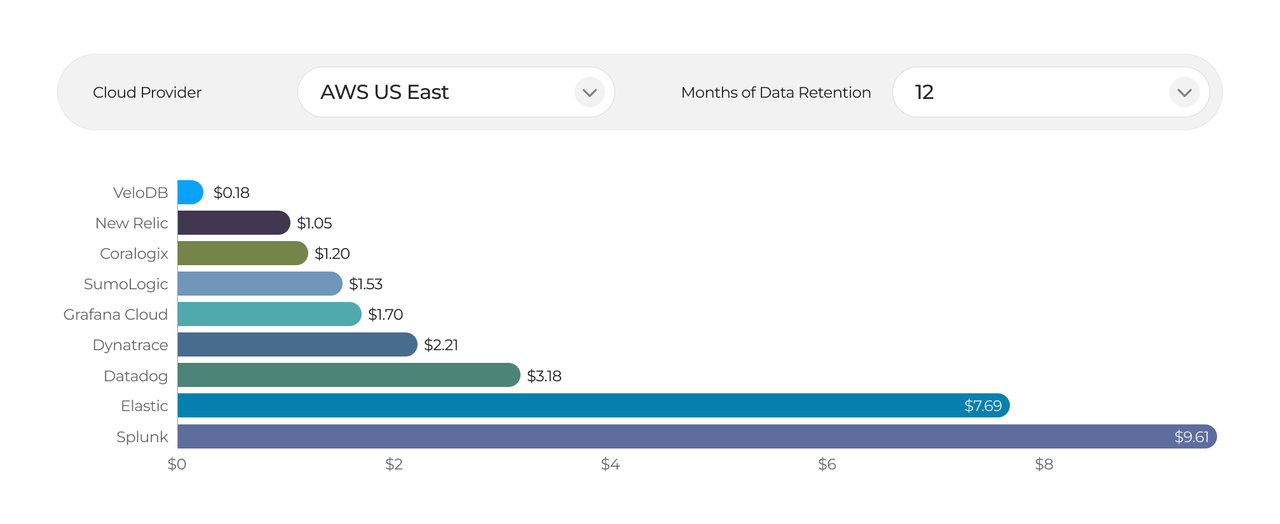
The figure below shows the price for each GB of logs ingested with 12 month retention. Compared to many observability products, VeloDB's cost advantage is very obvious, saving 94% compared to Datadog and 98% compared to Splunk.
Footnote:
VeloDB's pricing is calculated based on the pricing page and ingestion of 10MB/s per CPU core and moderate 5:1 compression estimate and 2x resource buffer.
Other vendors' pricing is based on https://hydrolix.io/pricing/
VeloDB Integration with OpenTemetry
VeloDB has built tight integrations with VeloDB, enabling seamless data integration through tools such as Doris Exporter. It is also recognized as a vendor who officially supports OTEL by the community
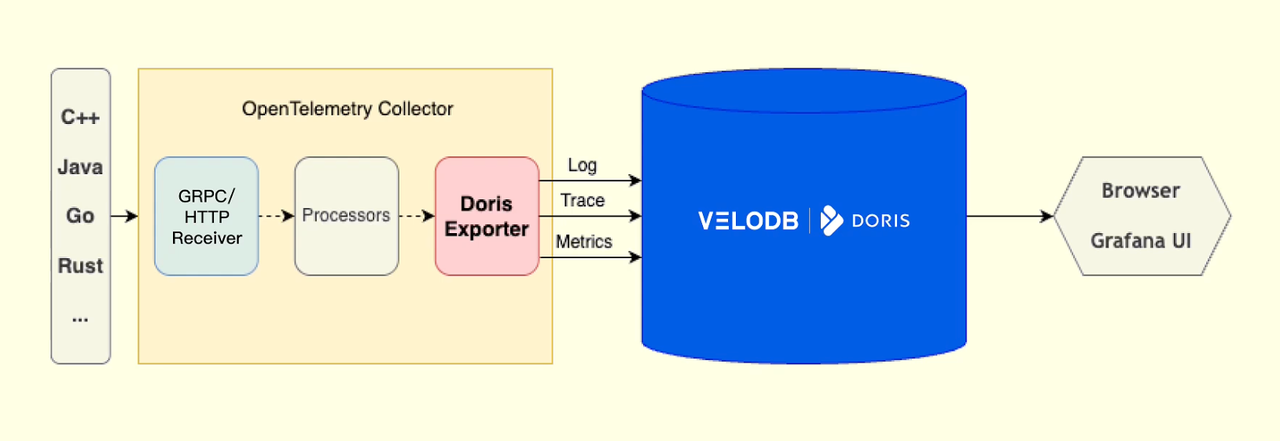
VeloDB contributed the Doris Exporter to the OpenTelemetry community, which can write observability data such as log, trace, metrics, etc. to Apache Doris or VeloDB, achieving high-performance data writing and low-cost storage. Doris Export can also automatically create tables and indexes in VeloDB, and delete outdated data according to user configuration. Users only need simple configuration to achieve the integration of OpenTelemetry and VeloDB, as shown in the following example.
# otelcol-config.yml
exporters:
  doris:
    endpoint: "http://host:http_port"
    mysql_endpoint: "host:mysql_port"
    database: otel
    username: admin
    password: "****"
    table:
      logs: otel_logs
      traces: otel_traces
      metrics: otel_metrics
    create_schema: true
    history_days: 30
VeloDB Integration with Grafana
Grafana is also well integrated with VeloDB. VeloDB is compatible with MySQL protocol and syntax, so you can connect to VeloDB through Grafana's built-in MySQL data source for queries and various types of visualization.
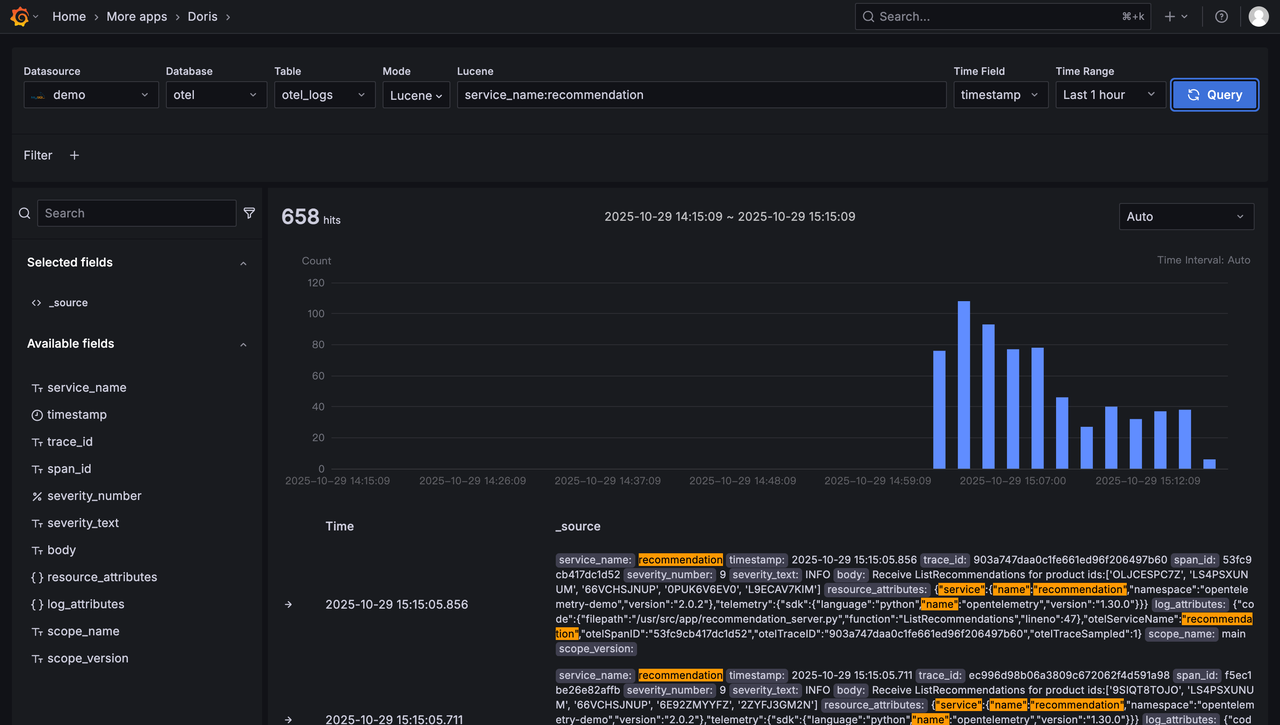
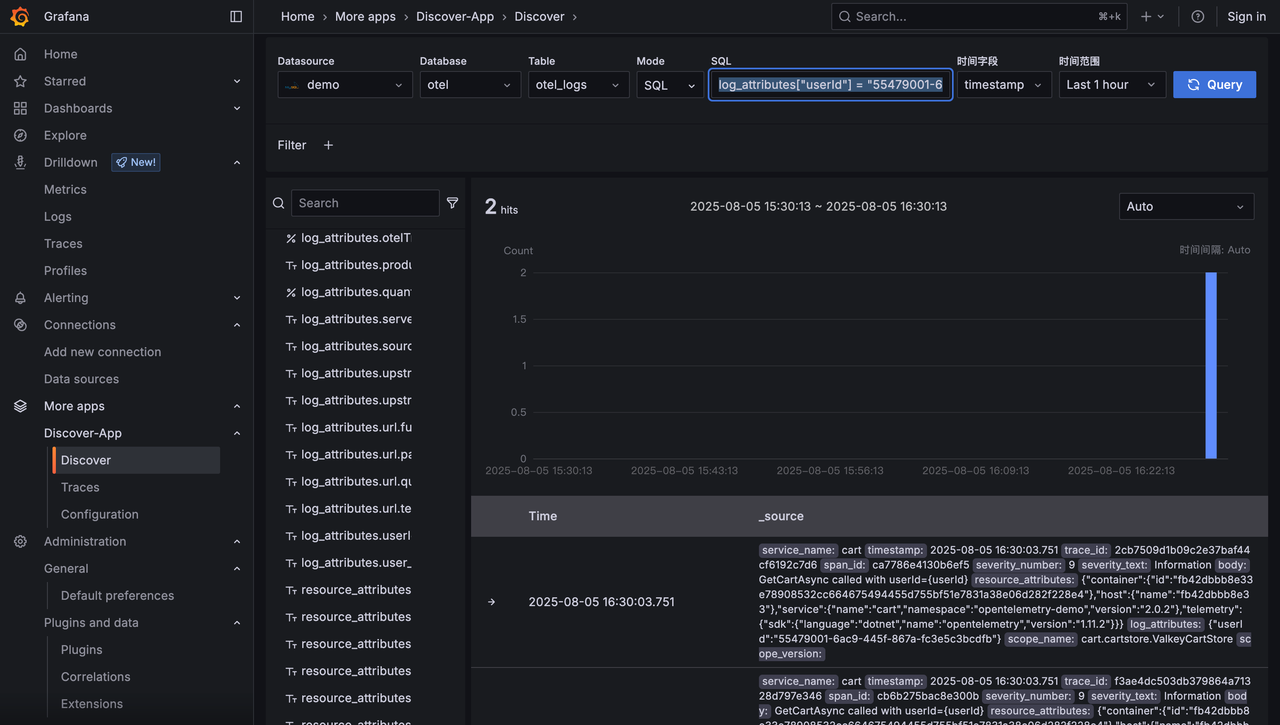
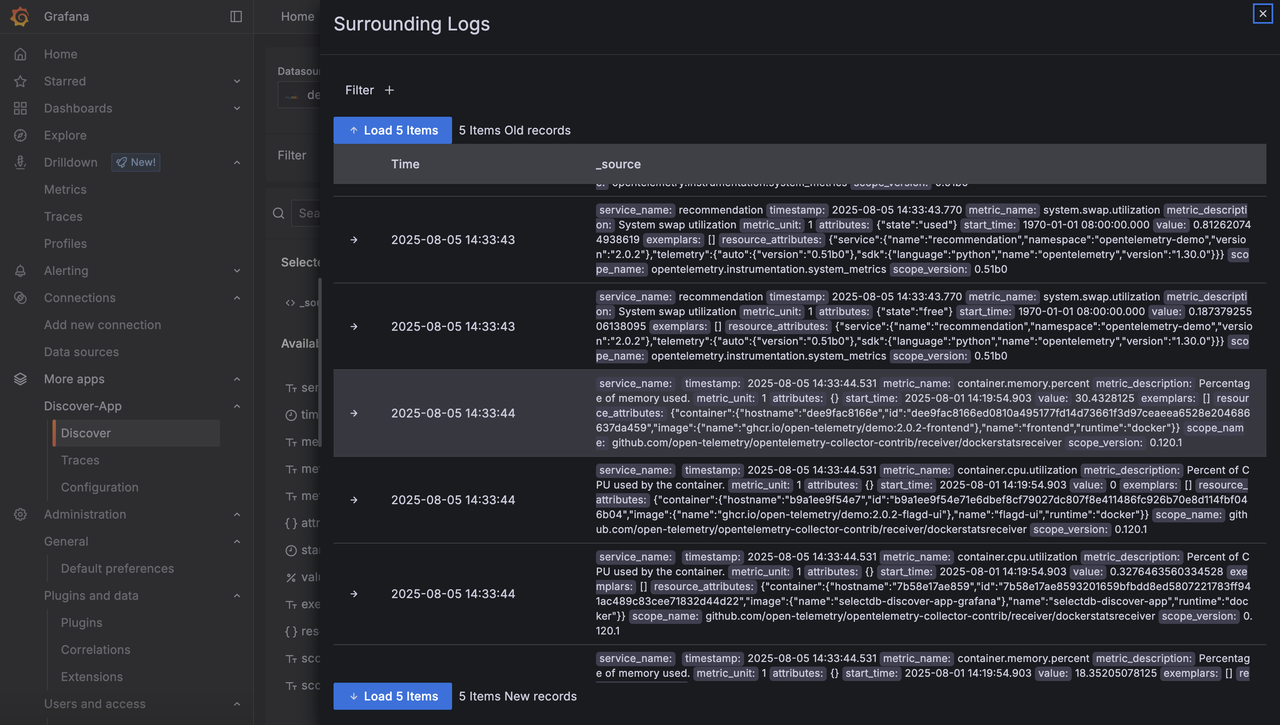
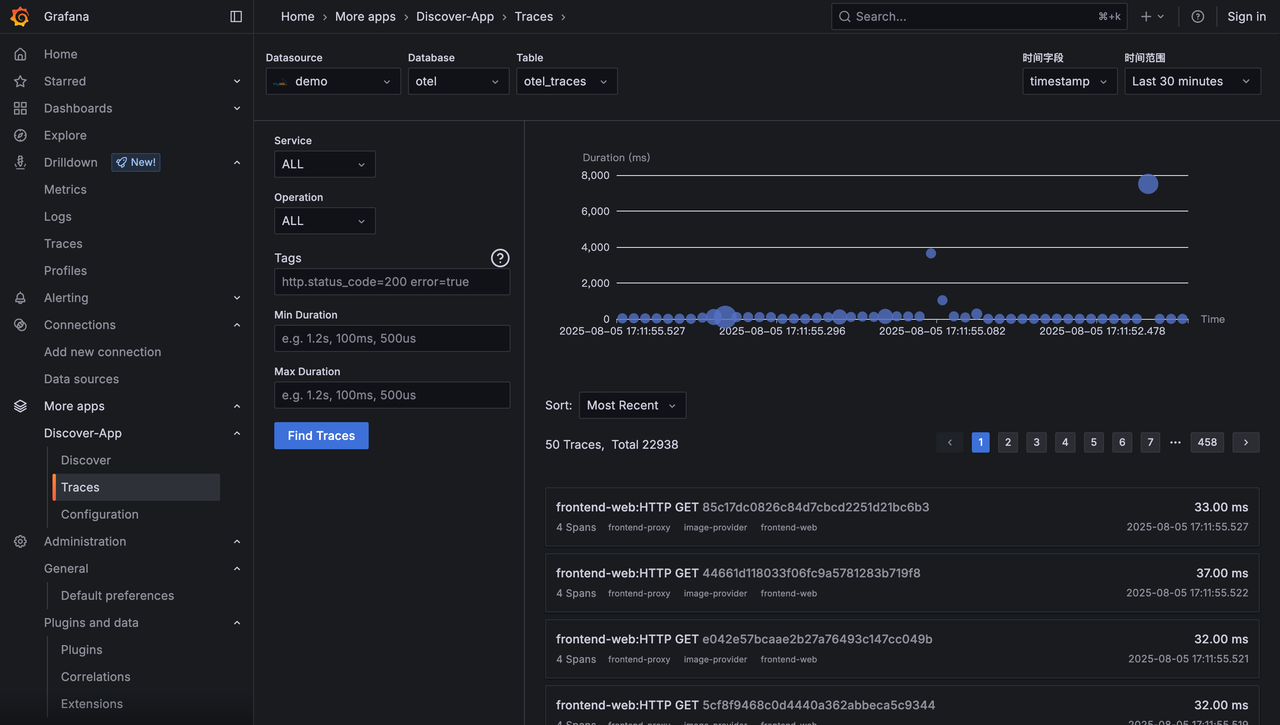
Furthermore, VeloDB developed and open sourced a Grafana Doris Plugin, providing better experience over the MySQL protocol. These improvements include: implementing the interactive search and analysis experience of Kibana Discover in Grafana, supporting both Lucene and SQL syntax, supporting viewing the context of a record, analyzing the data distribution of a certain field, interactively adding filtering conditions, dragging and dropping to select a time range, etc.
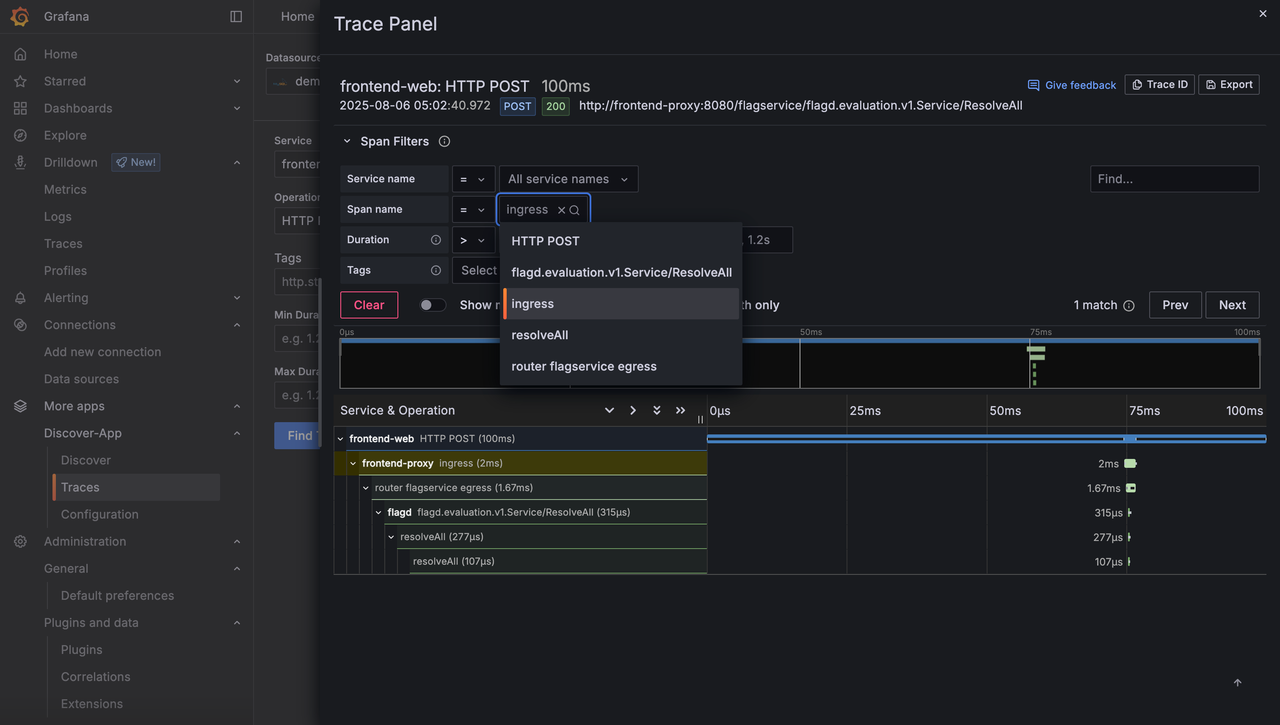
Grafana Doris Plugin also supports trace visualization analysis, including trace time distribution, waterfall chart, etc. It can also directly jump to the corresponding trace for linkage analysis from log search.
Summary
Using the OVG Stack (OpenTelemetry + Grafana + VeloDB), users can build a high-performance, low-cost, easy-to-use, and open observability platform. Observing business systems in real-time, doesn't have to come with a high "Observablility Tax", or vendor lock-ins
Start your OVG Stack journey with a free trial of VeloDB today. If you have more questions, please feel free to contact us for more help.