Web3 builders often face an architectural challenge when designing on-chain analytics: how to balance the need for sub-second data processing with real-time data analysis of massive historical on-chain data?
Both needs are critical to on-chain analytics, but they require different approaches. Sub-second data processing demands sub-second latency, while real-time on-chain analytics requires fast querying of terabytes of historical data.
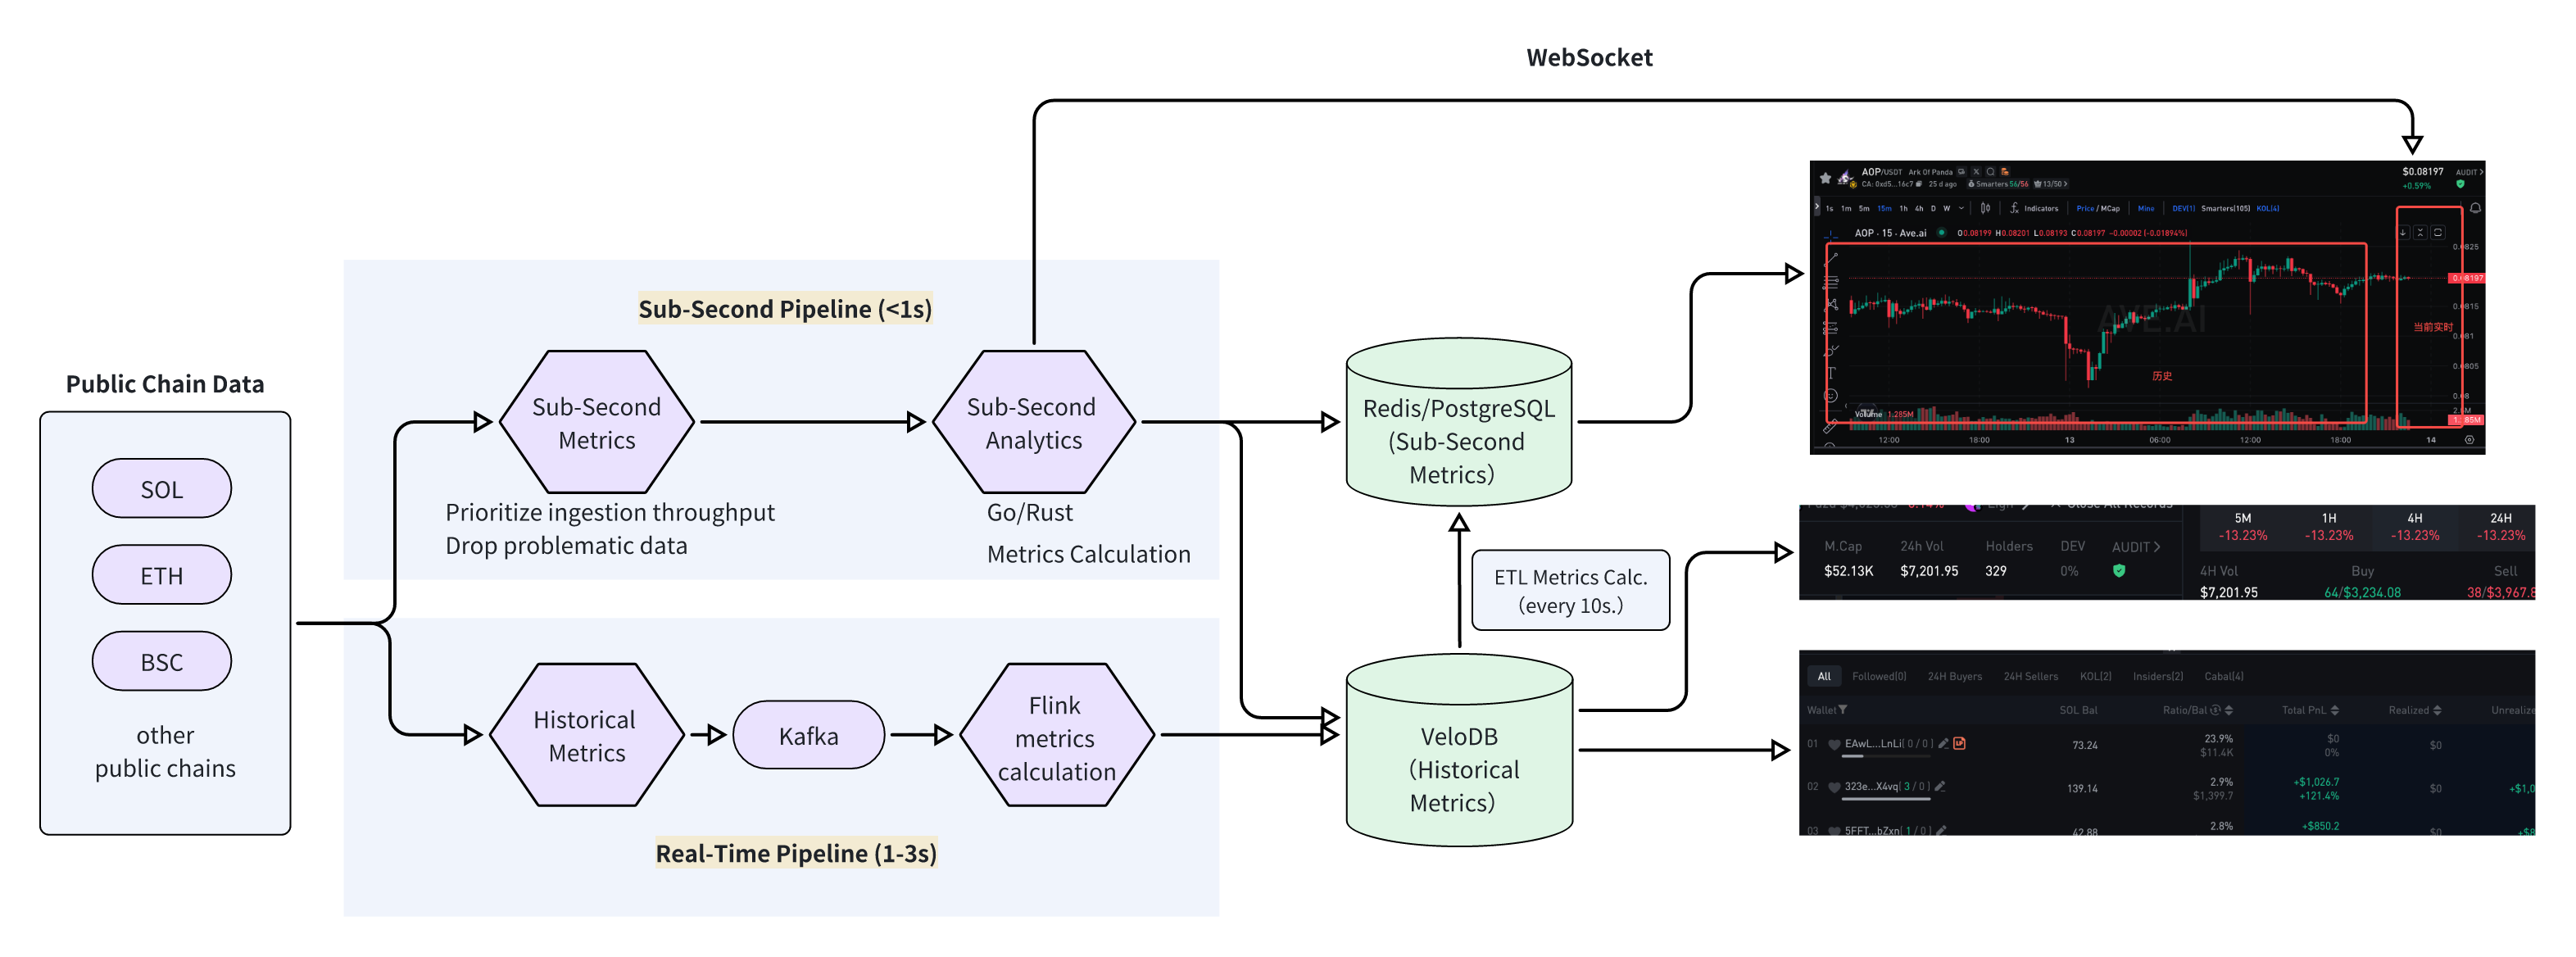
In this article, we present a dual-pipeline architecture to meet both demands in on-chain analytics, proven by production scenarios:
- Sub-Second Pipeline (<1s): Public Chain → Node Collector → Go/Rust Service → Redis/PostgreSQL → API/WebSocket
- This pipeline delivers sub-second latency for live updates, useful in live price feeds, instant transaction alerts, and real-time candlestick charts.
- Real-Time Pipeline (1-3s): Public Chain → Kafka → Flink → VeloDB → Application
- This pipeline provides real-time (1-3 seconds latency) deep analytics at scale, useful in calculating holder analysis, tracing fund origins, detecting insider trading, and wallet analysis.
VeloDB is a real-time analytics and search database powered by the popular Apache Doris. VeloDB's strengths lie in real-time data processing, complex query execution, and micro-batch computation, making it the ideal data infrastructure for a Web3 analytics pipeline that requires real-time analytics and complex queries.
Dual-Pipeline Architecture for On-Chain Analytics
To meet the dual requirements of sub-second data processing and real-time analysis, we designed a dual-pipeline architecture powered by VeloDB. The Sub-Second Pipeline handles low-latency, high-concurrency data streams, while the Real-Time Pipeline manages large-scale historical data storage, batch processing, and complex queries.
1. Sub-Second Pipeline: Analytics Service + Redis
The Sub-Second Pipeline is optimized for minimal latency and high responsiveness. It processes real-time on-chain events like trades and price fluctuations to generate and push metrics within seconds.
- Core Components: On-chain data collectors (nodes), a real-time metrics calculation service, a caching layer (Redis), and an API/WebSocket server.
2. Real-Time Pipeline: Deep Data Analytics (Flink + VeloDB)
The Real-Time Pipeline is built for massive data capacity and high computational throughput. It ingests near real-time data from the Sub-Second Pipeline and supports ad-hoc queries, micro-batch processing, and complex reporting for in-depth analysis.
- Core Components: A message queue (Kafka), a stream processing engine (Flink), the VeloDB database, and an application service layer.
The Sub-Second Pipeline Implementation Details
The Sub-Second Pipeline ensures that real-time metrics like token prices and transaction dynamics are delivered to users instantly.
1. Data Flow
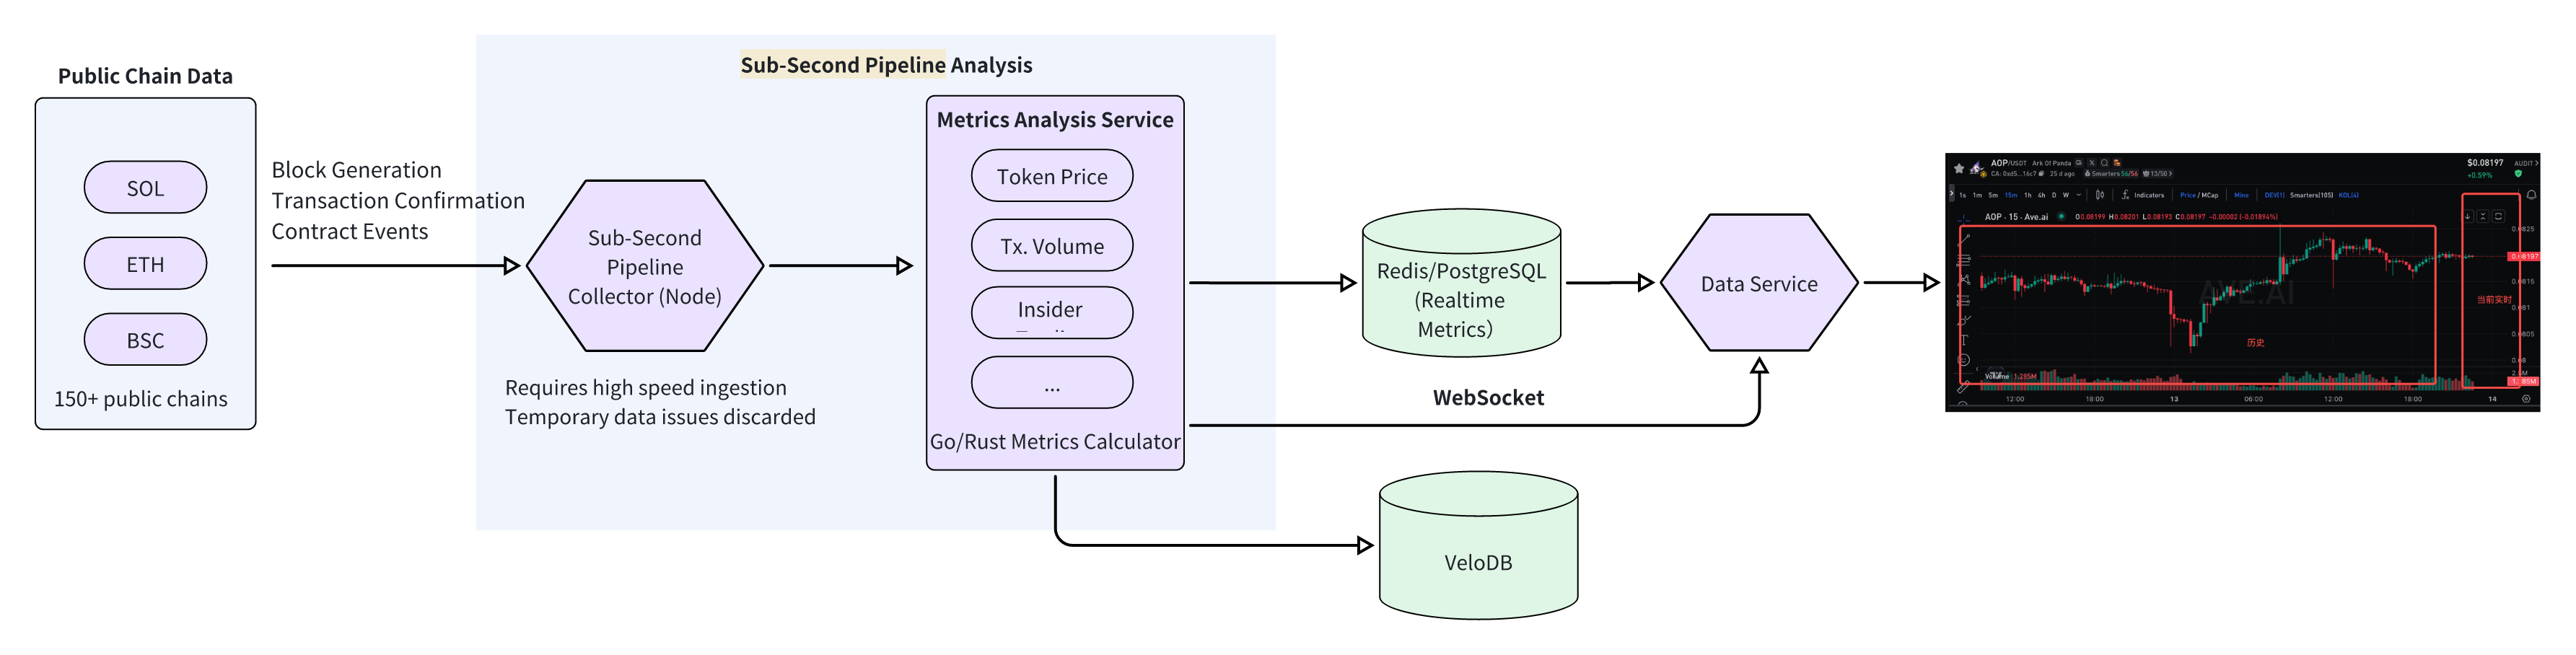
This pipeline is a linear, low-latency flow:
Public Chain → Node Collector → Go/Rust Service → Redis/PostgreSQL → API/WebSocket
1. On-Chain Data Collection: Full nodes (e.g., Geth, Solana validators) are deployed to listen for new blocks, transactions, and contract events, ensuring data integrity.
2. Real-Time Metrics Calculation: A high-performance service written in Go or Rust processes raw on-chain data. It calculates candlestick data, token prices, and trading volumes, and detects events such as insider trades.
3. Data Caching: Redis and PostgreSQL are used for ephemeral storage. Redis caches frequently accessed data like real-time candlestick charts for millisecond-level access. Processed metrics are also asynchronously written to VeloDB to bridge the gap with the Real-Time Pipeline.
4. Data Serving: An API provides real-time data to front-end applications, while a WebSocket server pushes live updates for candlestick charts and trade alerts.
2. Sub-Second Pipeline Metrics
The Sub-Second Pipeline focuses on high-frequency, real-time indicators:
- Candlestick data (OHLCV)
- Trade counts and volumes
- Buy/Sell statistics
- LP liquidity calculations
- Insider trading signals
- Smart money movements
- Dev wallet balance changes
- Sniper counts and trades
- Real-time transaction feeds
The Real-Time Pipeline Implementation Details
The Real-Time Pipeline leverages VeloDB's powerful storage and query engine to perform deep analysis on massive historical datasets.
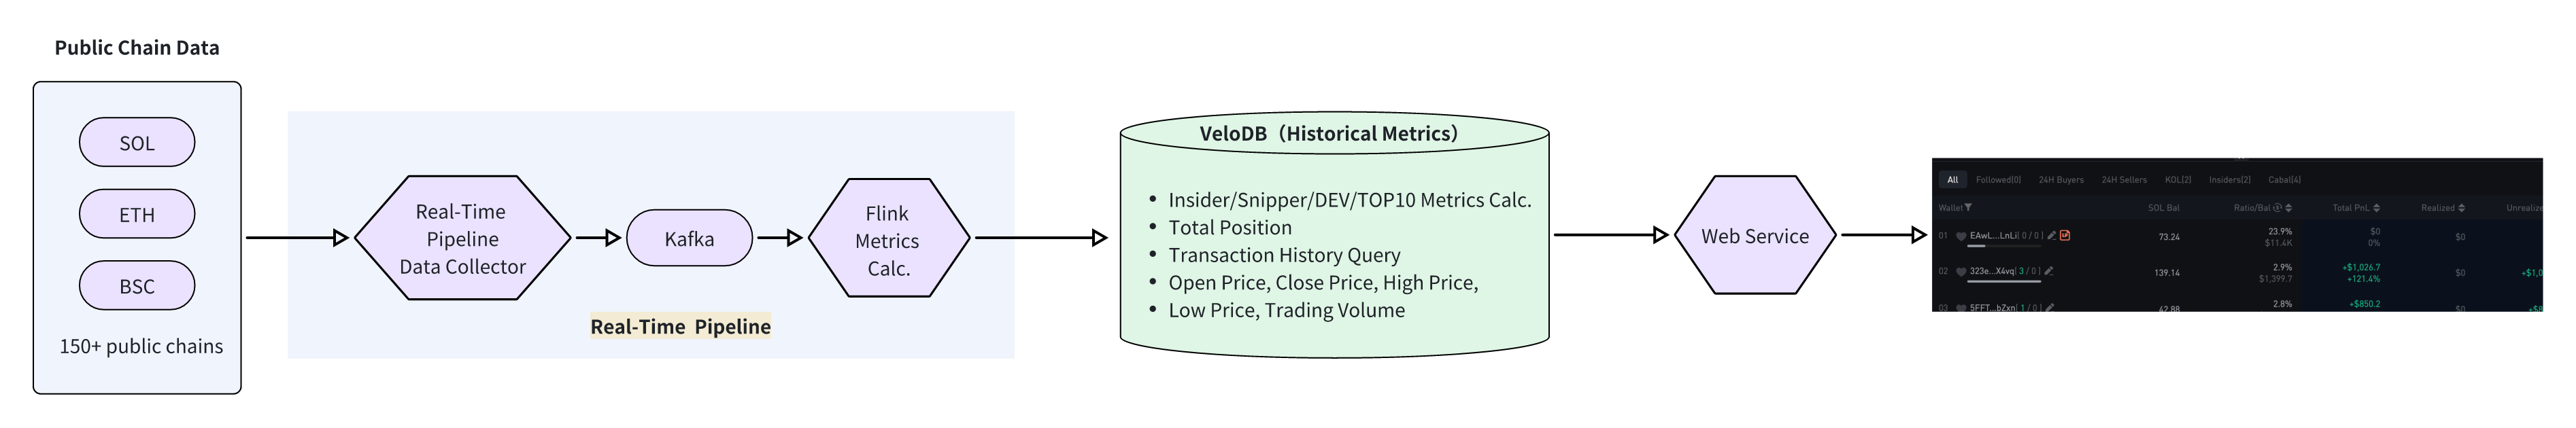
1. Data Flow
The Real-Time Pipeline uses a stream-processing model for robust, large-scale computation: Public Chain → Sub-Second Pipeline Collector (1-3s delay) → Kafka → Flink → VeloDB → Application
1. Data Ingestion: Near real-time data from the Sub-Second Pipeline collectors is pushed into a Kafka topic, which acts as a durable buffer against data spikes.
2. Micro-Batch Processing: Flink consumes data from Kafka and performs batch and aggregation calculations. This includes historical metric rollups, holder structure analysis, and building user behavior profiles.
3. Data Storage & Serving: Flink writes both the raw and aggregated data into VeloDB. Front-end applications query VeloDB via a dedicated API to retrieve historical data and analytical reports.
2. Calculating On-Chain Metrics with VeloDB
VeloDB offers several powerful features for efficiently calculating on-chain metrics from historical data.
- Ad-Hoc Query Acceleration: VeloDB uses partitioning, bucketing, and inverted indexes to accelerate queries on frequently used columns like
wallet_address,timestamp, andtoken_contract, improving performance by 10-100x. - Example: Querying the daily change in holdings and the Top 5 holders' share for a token over the last 30 days
-- Calculate daily holder changes and Top 5 ratio
WITH daily_hold AS (
    -- Aggregate wallet holdings by day
    SELECT
        DATE_TRUNC('day', block_time) AS stat_date,
        wallet_address,
        SUM(hold_amount) AS daily_hold_amount
    FROM token_hold_history
    WHERE token_contract = '0x1234567890abcdef1234567890abcdef12345678'
      AND block_time > CURRENT_DATE - INTERVAL '30 days'
    GROUP BY stat_date, wallet_address
),
daily_total AS (
    -- Calculate total daily holdings
    SELECT
        stat_date,
        SUM(daily_hold_amount) AS total_hold
    FROM daily_hold
    GROUP BY stat_date
),
daily_top5 AS (
    -- Rank holders to find the Top 5 each day
    SELECT
        stat_date,
        wallet_address,
        daily_hold_amount,
        ROW_NUMBER() OVER (PARTITION BY stat_date ORDER BY daily_hold_amount DESC) AS rank
    FROM daily_hold
)
-- Calculate the Top 5 ratio and daily change
SELECT
    dt.stat_date,
    dt.total_hold,
    SUM(CASE WHEN dt5.rank <= 5 THEN dt5.daily_hold_amount ELSE 0 END) / dt.total_hold AS top5_ratio,
    dt.total_hold - LAG(dt.total_hold) OVER (ORDER BY dt.stat_date) AS hold_change
FROM daily_total dt
LEFT JOIN daily_top5 dt5 ON dt.stat_date = dt5.stat_date
GROUP BY dt.stat_date, dt.total_hold
ORDER BY dt.stat_date;
- Synchronous Materialized Views: VeloDB supports incremental updates to materialized views based on row-level changes. When new trade data is ingested, only the affected rows in the view are updated, rather than performing a full refresh. This is ideal for high-frequency metrics like "24-hour token price change" or "Top 10 holder concentration."
- Example: A synchronous MV to calculate real-time 1-second candlestick data
-- Base table for Solana trades
CREATE TABLE `sol_trades_duplicate` (
    token_address VARCHAR(128) NOT NULL,
    pool_address VARCHAR(128) NOT NULL,
    side_token_address VARCHAR(128) NOT NULL,
    block_timestamp DATETIME NOT NULL,
    -- ... other columns
    side_type tinyint NOT NULL COMMENT 'ENUM: 1-BUY, 2-SELL',
    status tinyint NOT NULL COMMENT 'ENUM: 0-UnKnown, 1-SUCCEEDED, 2-FAILED',
    deleted BOOLEAN NOT NULL
) ENGINE=OLAP
DUPLICATE KEY(token_address, pool_address, side_token_address, block_timestamp)
AUTO PARTITION BY RANGE (date_trunc(`block_timestamp`, 'hour'))()
DISTRIBUTED BY HASH(`token_address`) BUCKETS 2
PROPERTIES ("storage_format" = "V2");

-- Materialized view for 1-second candlesticks
CREATE MATERIALIZED VIEW mv_sol_candlesticks_pt1s_duplicate
AS
SELECT
    token_address,
    date_trunc(block_timestamp, 'second') as ts,
    MIN(token_price_in_usd) as open_price_in_usd,
    MAX(token_price_in_usd) as close_price_in_usd,
    MIN_BY(token_price_in_usd, block_timestamp) as low_price_in_usd,
    MAX_BY(token_price_in_usd, block_timestamp) as high_price_in_usd,
    SUM(token_price_in_usd * token_amount) as volume_in_usd,
    SUM(token_amount) as volume
FROM sol_trades_duplicate
WHERE deleted = FALSE AND status = 1
GROUP BY token_address, date_trunc(block_timestamp, 'second')
ORDER BY token_address, date_trunc(block_timestamp, 'second');
- Asynchronous Materialized Views: For less time-sensitive rollups, VeloDB's asynchronous MVs can be refreshed on a custom schedule (e.g., every minute or hour). The engine uses a parallel "partition-level calculation + result merging" approach to significantly reduce computation time.
- Example: Asynchronous MVs for 1-minute, 1-hour, and 24-hour candlestick data
-- 1-minute candlestick MV
CREATE MATERIALIZED VIEW mv_sol_candlesticks_pt1m_duplicate
AS
SELECT
    token_address,
    date_trunc(block_timestamp, 'minute') as ts,
    -- ... OHLCV calculations
FROM sol_trades_duplicate
WHERE deleted = FALSE AND status = 1
GROUP BY token_address, date_trunc(block_timestamp, 'minute');

-- 1-hour candlestick MV
CREATE MATERIALIZED VIEW mv_sol_candlesticks_pt1h_duplicate
AS
SELECT
    token_address,
    date_trunc(block_timestamp, 'hour') as ts,
    -- ... OHLCV calculations
FROM sol_trades_duplicate
WHERE deleted = FALSE AND status = 1
GROUP BY token_address, date_trunc(block_timestamp, 'hour');

-- 24-hour candlestick MV
CREATE MATERIALIZED VIEW mv_sol_candlesticks_pt24h_duplicate
AS
SELECT
    token_address,
    date_trunc(block_timestamp, 'day') as ts,
    -- ... OHLCV calculations
FROM sol_trades_duplicate
WHERE deleted = FALSE AND status = 1
GROUP BY token_address, date_trunc(block_timestamp, 'day');
3. High-Performance Queries for Core Use Cases
VeloDB is exceptionally fast for key Web3 analytics queries, thanks to its core technologies like partitioning, columnar storage, vectorized execution, and rich indexing.
1. Calculating Insider/Sniper/Dev/Top10 Holder Metrics
- Table Schema: The
bsc_account_balancetable is bucketed bytoken_addressto co-locate data for the same token, speeding up queries.
CREATE TABLE `bsc_account_balance` (
  `token_address` varchar(65533) NOT NULL,
  `balance` decimal(38,9) NULL,
  `account_address` varchar(65533) NOT NULL,
  `balance_block_number` bigint NULL, -- Sequence column
  `updated_at` datetime NULL,
  INDEX idx_token_address (`token_address`) USING INVERTED
) ENGINE=OLAP
UNIQUE KEY(`token_address`, `balance`, `account_address`)
DISTRIBUTED BY HASH(`token_address`) BUCKETS 32
PROPERTIES ("enable_unique_key_merge_on_write" = "true");
- Calculating Holdings for Different Holder Types (Insider, Sniper, Dev): We can batch-calculate holdings for multiple tokens and multiple holder types using an
INclause. Our tests on a 1-billion-row Solana dataset show that VeloDB can calculate these metrics for 200 real-time tokens in under one second.
-- Query to calculate holdings by token and holder type
select a.token_address, h.type, sum(balance)
from bsc_account_balance a
left join bsc_token_holder_tagged_tmp h on a.account_address = h.address
where a.token_address in ('0xf4ed363144981d3a65f42e7d0dc54ff9eef559a1', ...)
  and h.type in (25, 19, 16) -- 25:dev, 19:sniper, 16:insider
group by a.token_address, h.type
limit 10;
- Performance Benchmark:
| Holders per Token | Tokens Queried | Query Time (s) | Concurrency |
|---|---|---|---|
| 5k | 200 | 0.3 ~ 0.5 | 3 |
| 10k | 200 | 0.2 ~ 0.4 | 1 |
| 100k | 200 | 0.7 ~ 2.0 | 1 |
| 1M | 1 | 1.5 ~ 2.0 | 1 |
| 2M | 1 | 2.0 ~ 3.0 | 1 |
| 5M | 1 | 2.0 ~ 4.0 | 1 |
- Top 10 Holder Ratio Calculation: Use a subquery with
ORDER BY ... LIMITto efficiently find the top 10 holders and calculate their ownership percentage.
select sum(balance) / {total_amount}
from (
    select balance
    from bsc_account_balance
    where token_address = '0x89aba1453f58ab08056da973163a67efed95a432'
    order by balance desc
    limit 10
) t;
2. Analyzing Holder Changes: VeloDB's built-in window functions (LAG, LEAD) are perfect for calculating changes in holdings over time.
-- Calculate Top 3 daily holder increases/decreases
SELECT
    stat_date,
    wallet_address,
    hold_amount - LAG(hold_amount) OVER (PARTITION BY wallet_address ORDER BY stat_date) AS hold_change
FROM daily_holder_table;
3. Querying Transaction History: VeloDB’s composite indexes and predicate pushdown capabilities make it extremely fast for filtering transactions. For a query filtering by wallet_address, time_range, and transaction_type, the index directly locates the data, and filters are pushed down to the storage layer, minimizing data scanned.
- Example: Find all DEX 'BUY' transactions over 1000 USDT for a specific wallet within a one-week period
-- 1. Create the transaction table, partitioned by time
CREATE TABLE dex_transaction (
    tx_hash VARCHAR(66) NOT NULL, -- Transaction hash
    transaction_time datetime NOT NULL,
    wallet_address VARCHAR(42) NOT NULL,
    token_contract VARCHAR(42) NOT NULL,
    transaction_type VARCHAR(10) NOT NULL, -- BUY/SELL
    amount DECIMAL(30,18) NOT NULL,
    price_usdt DECIMAL(30,18) NOT NULL,
    fee_usdt DECIMAL(10,6) NOT NULL
) ENGINE=OLAP
UNIQUE KEY(`tx_hash`, `transaction_time`, `wallet_address`)
AUTO PARTITION BY RANGE (date_trunc(`transaction_time`, 'hour'))()
DISTRIBUTED BY HASH(`wallet_address`) BUCKETS 2;

-- 2. Execute the precise query
SELECT
    tx_hash,
    token_contract,
    amount,
    price_usdt,
    (amount * price_usdt) AS trade_amount_usdt,
    transaction_time,
    fee_usdt
FROM dex_transaction
WHERE wallet_address = '0x7890abcdef1234567890abcdef1234567890abc'
  AND transaction_type = 'BUY'
  AND transaction_time BETWEEN '2024-10-01 00:00:00' AND '2024-10-07 23:59:59'
  AND (amount * price_usdt) > 1000 -- Filter is pushed down to storage
ORDER BY transaction_time DESC;
Solution Advantages
- Low Latency & High Concurrency: The dual-pipeline architecture separates real-time and analytical workloads. The Sub-Second Pipeline provides sub-second responses for monitoring, while the Real-Time Pipeline leverages VeloDB's distributed architecture to support thousands of concurrent queries across billions of rows for deep analysis.
- Massive Data Scalability: VeloDB can efficiently store and process petabytes of on-chain data. Features like materialized views and optimized indexing solve the common database pain points of slow queries and high computational load.
- Flexibility and Extensibility: The solution supports multi-chain data ingestion from Ethereum, BSC, Solana, and more. VeloDB can be scaled out dynamically by adding nodes to meet growing business needs.
- Comprehensive, Full-Funnel Analytics: From real-time token metrics to historical wallet P&L and from insider trading detection to smart money tracking, this architecture covers the entire spectrum of Web3 analytics.
Core Web3 On-Chain Analytics Use Cases
Web3 analytics primarily revolves around two key entities: Tokens and Wallets. The dual pipeline architecture can help platforms to serve various stakeholders by providing insights into market performance, fund movements, risk management, and user behavior.
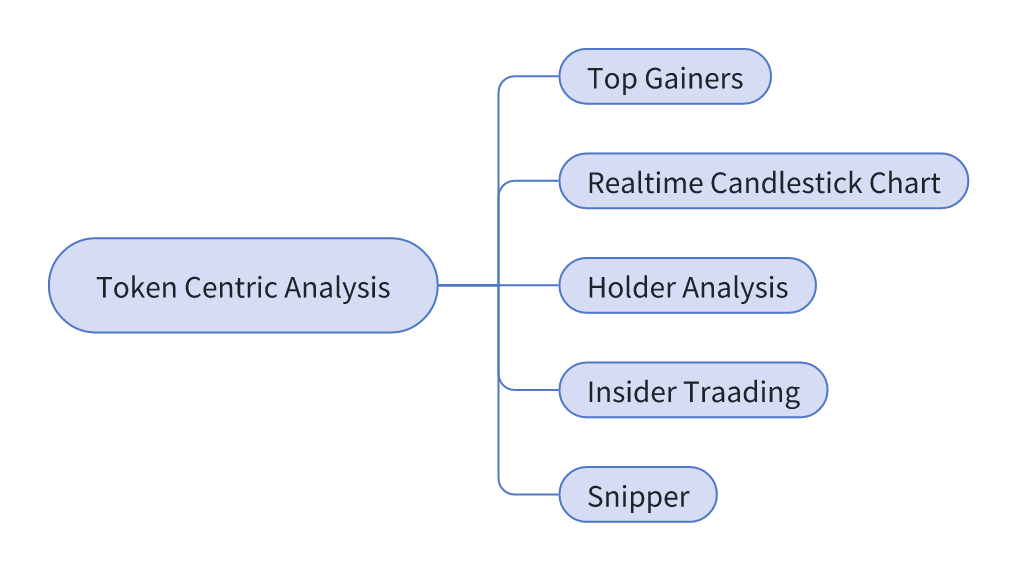
1. Token-Centric Analysis
Tokens are the core assets of the Web3 ecosystem. Their price action, ownership structure, and transaction patterns directly reflect market sentiment and risk.
- Top Gainers/Pump Lists: Identify tokens experiencing rapid price and volume surges in real-time. By filtering based on transaction frequency and capital concentration, these lists offer investors a snapshot of market hotspots.
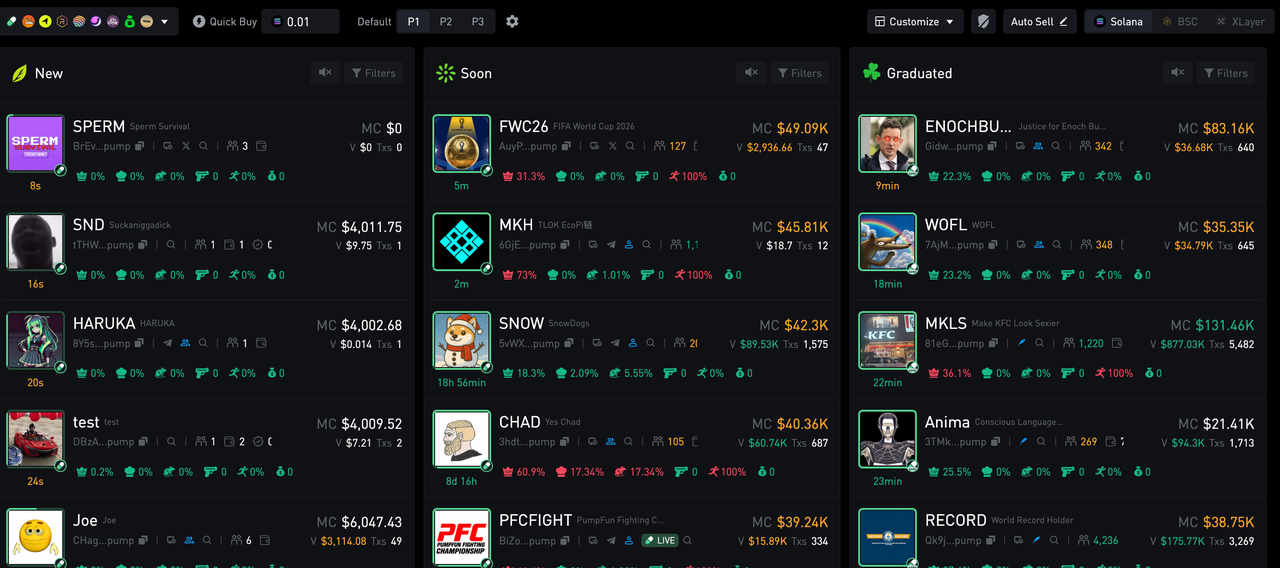
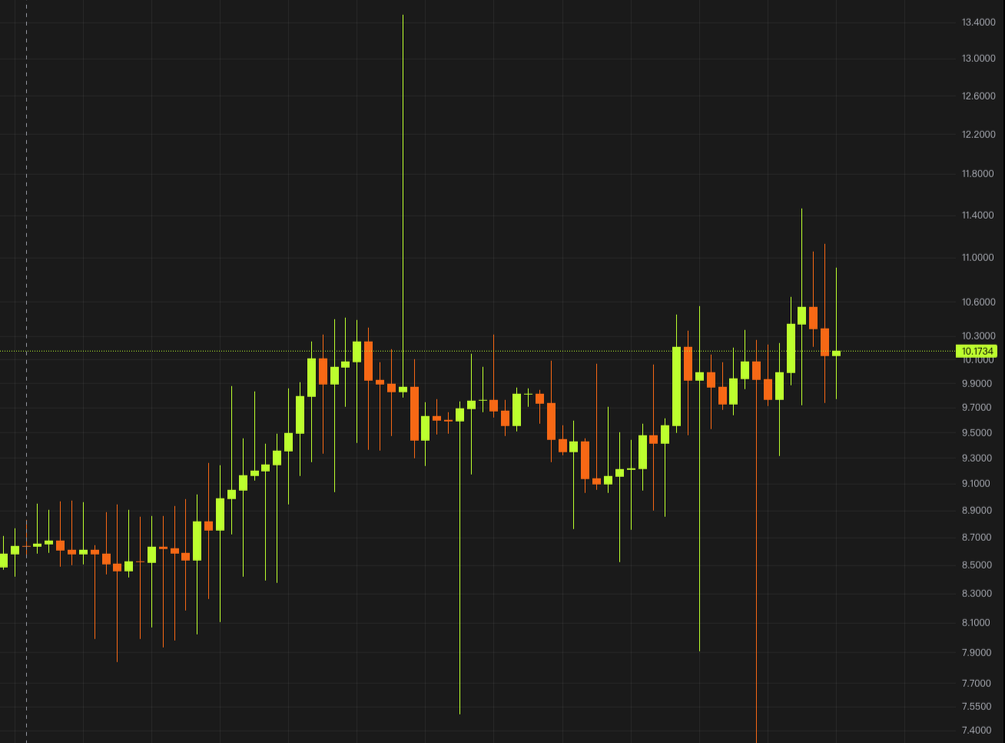
- Real-Time Candlestick (K-Line) Charts: Display second- or minute-level price movements (OHLC), volume, and turnover. These charts, delivered via WebSocket, are essential for traders and require multi-period flexibility (1m, 5m, 1h).
- Holder Analysis:
- Top N Holders: Analyze the distribution of token ownership to identify centralization risks where a few wallets hold a majority of the supply.
- Dev/Team Wallet Monitoring: Track the holdings of project developers and core team members to detect large sell-offs or transfers that could impact market confidence.
- Insider Trading (Rat Trading) Analysis: Detect suspicious trading activity by correlating wallets' buy/sell orders with sharp price movements. This involves identifying large buys just before a price pump and subsequent sells at the peak, often from wallets linked to the project team.
- Sniper Analysis: In DEX environments, identify wallets that exploit trading mechanisms like slippage or low liquidity for arbitrage. This requires analyzing order submission times, price execution vs. market price, and transaction size relative to the liquidity pool.
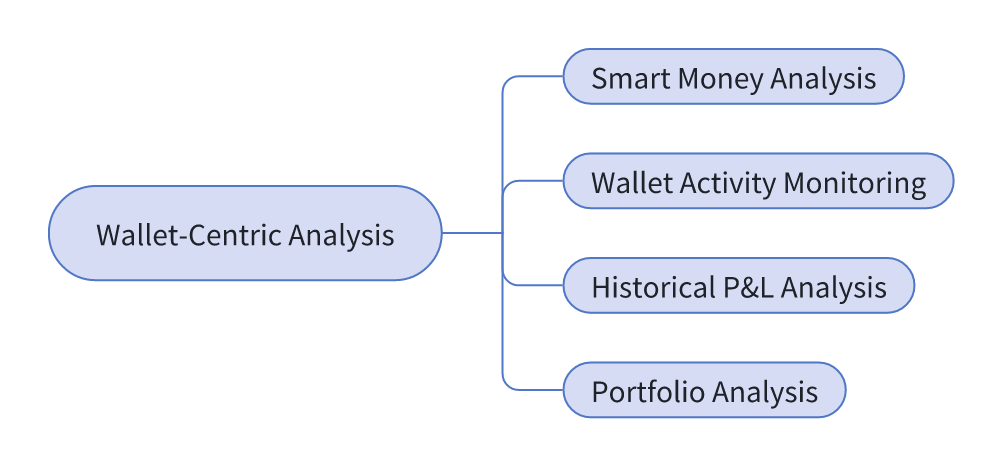
2. Wallet-Centric Analysis
Wallets are the primary tool for Web3 users to manage assets and interact with dApps. Their transaction patterns reveal "smart money" movements and investment strategies.
- Smart Money Analysis: Identify wallets with a history of high profitability and precise market timing. By tracking their portfolio changes, token choices, and entry/exit points, other investors can gain valuable market signals.
- Wallet Activity Monitoring: Track real-time wallet interactions, including token transfers, DEX swaps, NFT mints, and smart contract calls. This helps gauge user engagement and detect anomalies, such as interactions with suspicious contracts or large cross-chain transfers.
- Historical P&L Analysis: Calculate a wallet's overall profit and loss over various timeframes (daily, weekly, monthly) and on a per-token basis. This helps users understand their investment performance in detail.
- Portfolio Analysis: Provide a complete breakdown of a wallet's current holdings, including token allocation, quantity, and market value. Tracking historical changes reveals the wallet's investment strategy, such as a preference for blue-chip tokens or early-stage projects.
Conclusion and Future Outlook
This solution, built on VeloDB, successfully addresses the core challenges of on-chain data analysis by using a "Fast Lane + Slow Lane" architecture. It provides a complete, end-to-end pipeline for data collection, computation, storage, and serving, enabling developers to build powerful Web3 analytics applications.
As the Web3 ecosystem evolves, on-chain data will only grow in complexity and scale. VeloDB will continue to enhance its performance, multi-chain data fusion capabilities, and AI-driven analytics features. Future work includes introducing linked analysis between NFTs and tokens and tracking cross-chain fund flows, providing even more powerful tools to support the healthy and sustainable growth of the Web3 space. Contact the VeloDB team to learn more about Web3 use cases.