When using Elasticsearch for observability, especially log storage and analysis, low write performance and high cost are a headache for many companies. VeloDB has made a lot of optimizations for performance and cost in observability scenarios, and we have verified its effectiveness through testing.
1. Benchmark Goals and Methodology
The purpose of the test is to fairly compare the actual performance and cost of VeloDB and Elasticsearch in the observability scenario and to provide users with reference data. To be as realistic and fair as possible, we designed the comparative test as follows:
- Testing environment: Use Elastic Cloud and VeloDB Cloud online products for testing without any targeted tuning.
- Test data: Use Elastic's official performance test set HTTP logs, not a test set optimized for VeloDB. Using this test set actually leans more towards Elastic.
- Test content: Comparison of write performance, query performance, storage space, and cost, which are the most concerning metrics for users in observability scenarios.
- Testing method: The first stage compares the performance under the same resources, and the second stage compares the cost required to support the same load. The second stage goes beyond traditional performance testing to verify whether the performance advantage can be translated into a cost advantage in real-world user needs, rather than just a deduction.
2.Performance Comparison Under Identical Resources
In the first phase of testing, compare the performance and cost of Elastic Cloud and VeloDB Cloud under the same configuration.
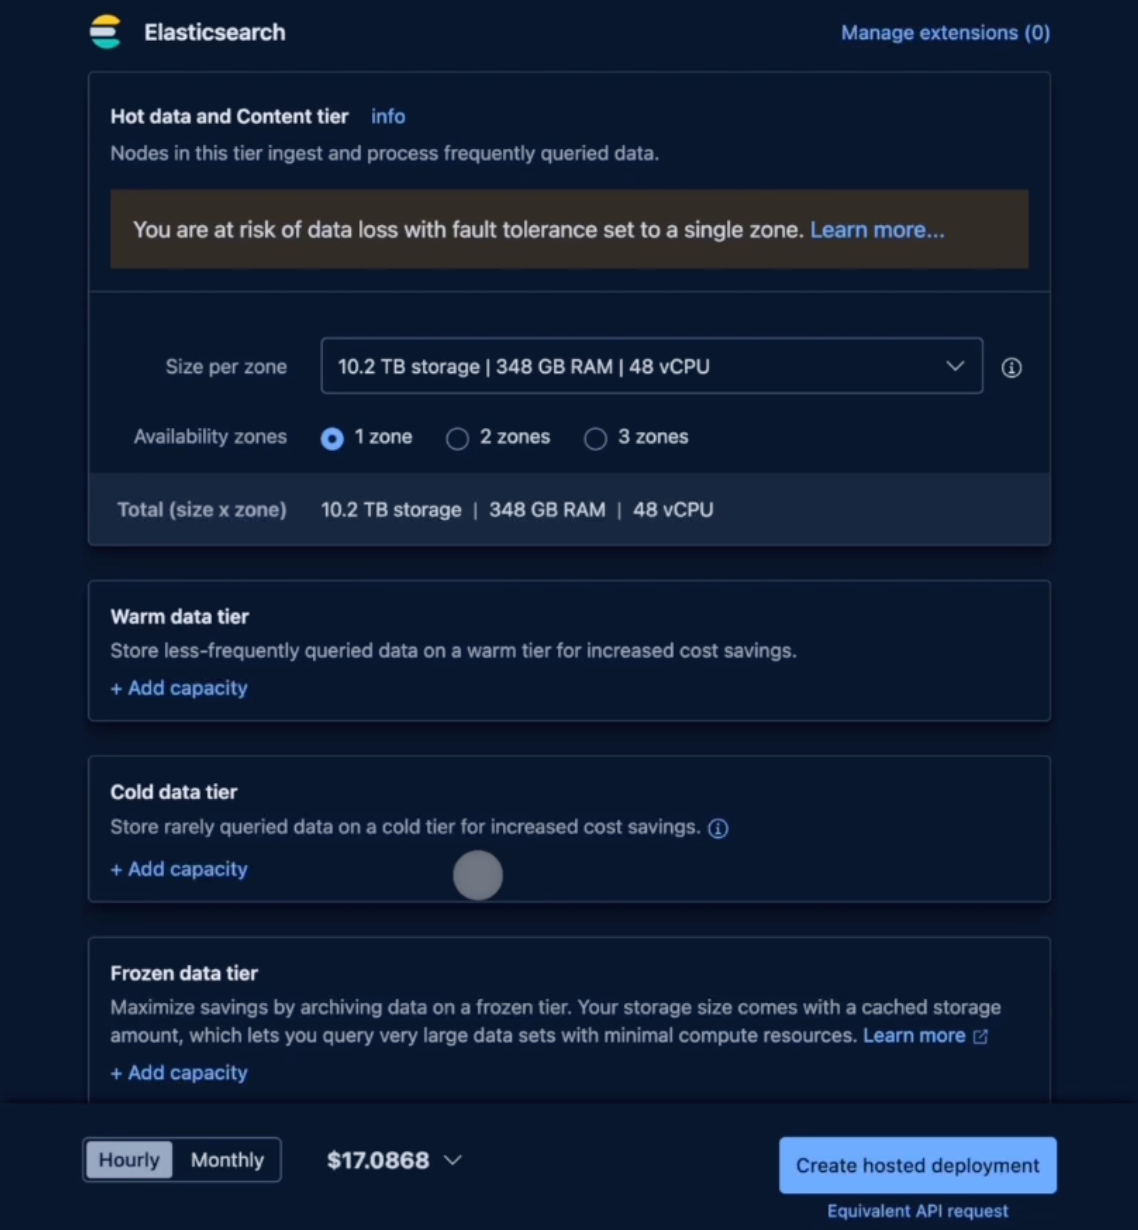
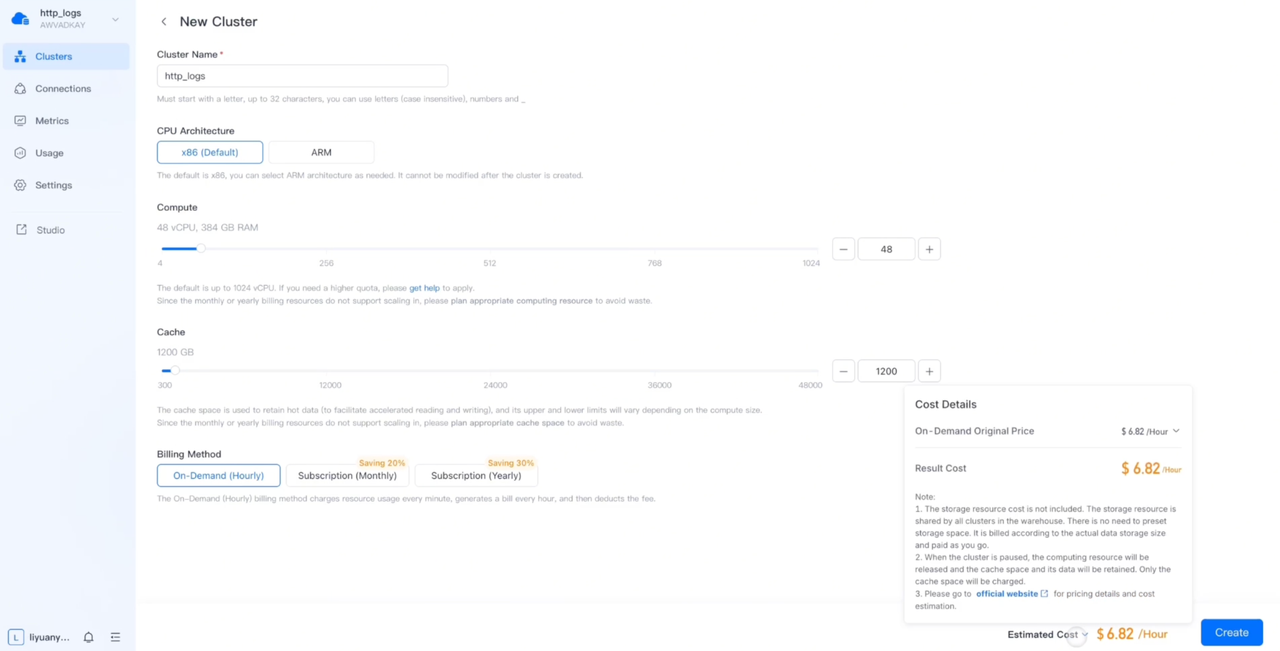
The first step is to purchase clusters with the same configuration (48 vCPU, 348GB RAM) in Elastic Cloud and VeloDB Cloud online products, with costs of 17.0868 dollars/hour and 6.82 dollars/hour, respectively. It should be noted that the storage space configuration in Elastic Cloud is 10.2 TB bound to CPU and RAM, while the storage space in VeloDB Cloud is used on demand.
In the second step, create an index in Elastic Cloud and a table in VeloDB Cloud. To ensure fairness, both systems use the same schema, including field type, index type, shared/tablet quantity, etc. It should be noted that Elasticsearch's index roughly corresponds to VeloDB's table.
In the third step, import the same HTTP logs dataset to Elastic Cloud and VeloDB Cloud. Elastic Cloud takes 6m55s, while VeloDB Cloud takes 55s. VeloDB Cloud is 7.5 times faster than Elastic Cloud.
In the fourth step, run queries from the HTTP logs test set in Elastic Cloud and VeloDB Cloud, respectively. The first run (cold) in Elastic Cloud took 2.114 seconds, the second run (hot) took 1.138 seconds, and the first run (cold) in VeloDB Cloud took 0.666 seconds, and the second run (hot) took 0.363 seconds. VeloDB Cloud is 3.1 times faster than both cold and hot runs in Elastic Cloud.
In the fifth step, get the storage space usage in Elastic Cloud and VeloDB Cloud, respectively. Elastic Cloud has a storage space usage of 19.7GB, while VeloDB Cloud has a storage space usage of 3.3GB. VeloDB Cloud has a storage space reduction of 83% compared to Elastic Cloud.
Through this test, it can be seen that under the same configuration, VeloDB Cloud is 7.5 times faster in data import performance, 3.1 times faster query performance, and 83% lower storage space than Elastic Cloud. This means that, under the same configuration, users of VeloDB Cloud will achieve several times better performance than those using Elastic Cloud.
Moreover, in the observability scenario, users are more concerned about whether the same load and performance can reduce costs. Therefore, the following test will verify how much the real cost advantage VeloDB Cloud's performance advantage can be transformed into.
3.The Cost Breakthrough: From Performance Leadership to Real Cost Reduction
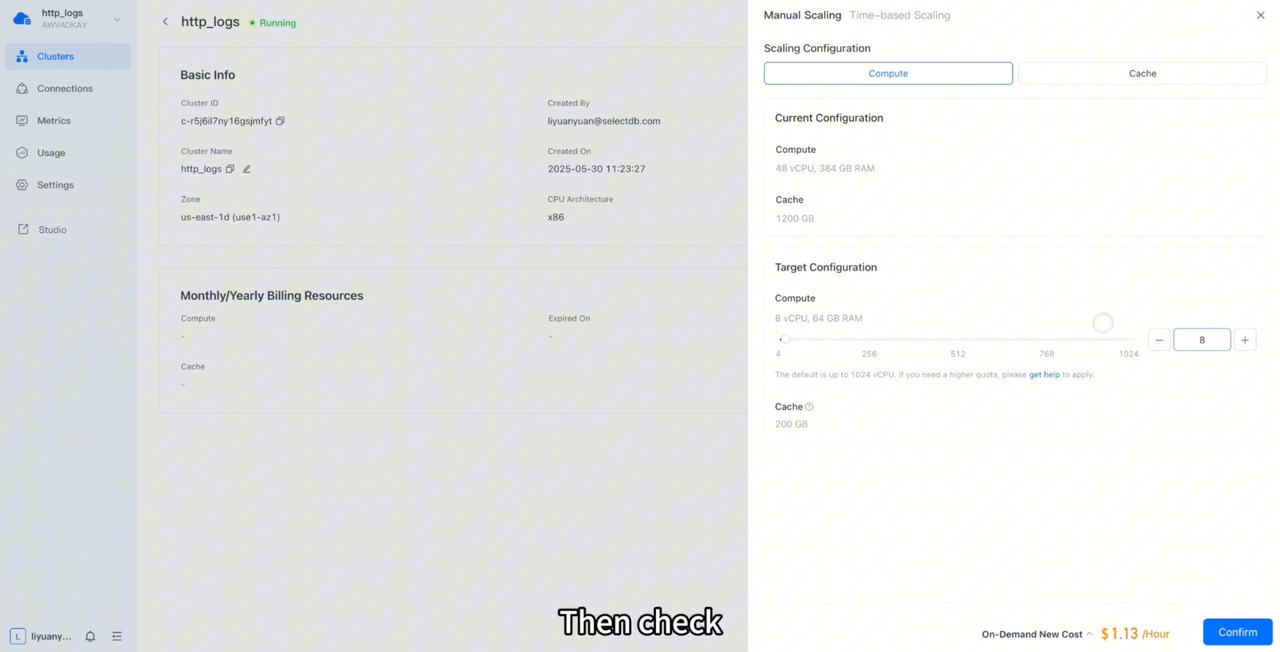
In the second phase of testing, VeloDB Cloud will be reduced to 1/6 of its original size to compare its performance with Elastic Cloud using 6x resources.
The first step is to reduce the cluster size of VeloDB Cloud 48 vCPU to 8 vCPU, and the cost is also greatly reduced to 1.13 dollars/hour.
The second step is to create the same table in the VeloDB Cloud cluster with 8 vCPUs.
In the third step, import the same HTTP logs dataset into the VeloDB Cloud cluster with 8 vCPUs. It takes 3m12s, which is twice as fast as the Elastic Cloud cluster with 48 vCPUs.
In the fourth step, run queries from the HTTP logs test set in the 8 vCPU VeloDB Cloud cluster. The first run (cold) took 1.839s to run, and the second run (hot) took 1.778s. The 8 vCPU VeloDB Cloud is 15% faster than the 48 vCPU Elastic Cloud cluster in cold run.
In the fifth step, get the storage space usage in the 8 vCPU VeloDB Cloud cluster. The storage space usage of VeloDB Cloud is still 3.3GB, which is 83% lower than that of Elastic Cloud.
Through this test, we can see that after reducing VeloDB Cloud's resources to 1/6 of Elastic Cloud's**, the cost is only 1.13 dollars/hour, which is 93% less than Elastic Cloud's 17.0868 dollars/hour.** Despite such a significant cost reduction, the performance still maintains significant advantages: data import performance is twice as fast, cold query performance is 15% faster, and storage space is reduced by 83%.
This means that, for users switching from Elastic Cloud to VeloDB Cloud to support the same load, VeloDB Cloud will deliver a real 93% cost reduction and better performance.
4.Why VeloDB Can Reduce Costs So Dramatically
VeloDB Cloud's great performance and cost advantages are due to extensive optimizations for observability scenarios.
- VeloDB uses columnar storage for both data and indexes and employs the ZSTD compression algorithm, resulting in high compression rates that can greatly reduce storage space. In addition, VeloDB stores all data in low-priced object storage, and hot data is cached and accelerated on local disks such as SSD, using the characteristics of observability data cold and hot layering to reduce the unit price of storage space. These features enabled VeloDB to deliver storage costs an order of magnitude lower than Elasticsearch.
- VeloDB adopts a storage-computation separation architecture. When writing data, there is only one computation consumption at the computation layer, avoiding the need for multiple copies of Elasticsearch's storage-computation integrated architecture. In addition, VeloDB has designed a time series compaction strategy for time-series data such as logs and traces, reducing the write amplification of background data merges from 3 to 1, allowing more resources to be used for real writes.
- VeloDB was designed for real-time analytics, which means it supports a wide range of aggregations, often used in observability. And for search queries, VeloDB implements an inverted index in a way that's optimized for log search and the
topnqueries likeSELECT * FROM log WHERE message MATCH 'error' ORDER BY time DESC LIMIT 100. The result is that VeloDB is 2x faster for search queries and 10x faster for aggregation queries.
5.Conclusion
Under the HTTP logs benchmark workload, VeloDB Cloud achieves a 93% cost reduction compared to Elastic Cloud. In real-world production environments, many users have already replaced Elasticsearch with VeloDB or Apache Doris at PB-scale, achieving significant cost savings. You can read user stories from Netease, MiniMax, CITI Bank to learn more.
We encourage users to run their own benchmarks and try VeloDB Cloud to validate the results firsthand.