TL;DR:
A leading AI and Speech Technology company upgraded its observability platform by replacing Elasticsearch and Loki with Apache Doris. This transition addressed critical issues of high storage costs with Elasticsearch and slow query performance with Loki. The results:
- 10x faster query performance
- Storage size reduced to 1/6th of Elasticsearch (approx. 83% savings)
- Efficient handl ing of 10TB / 60 billion logs daily
- Flexible JSON handling with Doris's VARIANT data type
The Challenge: Drowning in Data, Insufficient Observability
For any modern tech company, observability (insights from logs, traces, and metrics) is the bedrock of service stability. This AI leader's observability platform is crucial for monitoring infrastructure, applications, and business services. Faced an ever-growing deluge of data (up to 100 TB and tens of billions of log entries daily) and an entry concurrency hitting 500,000 TPS, it has clear goals: high throughput, low-latency queries (seconds, not minutes), cost-effective storage, and ease of use.
This journey began with an ELK (Elasticsearch, Logstash, Kibana) stack.
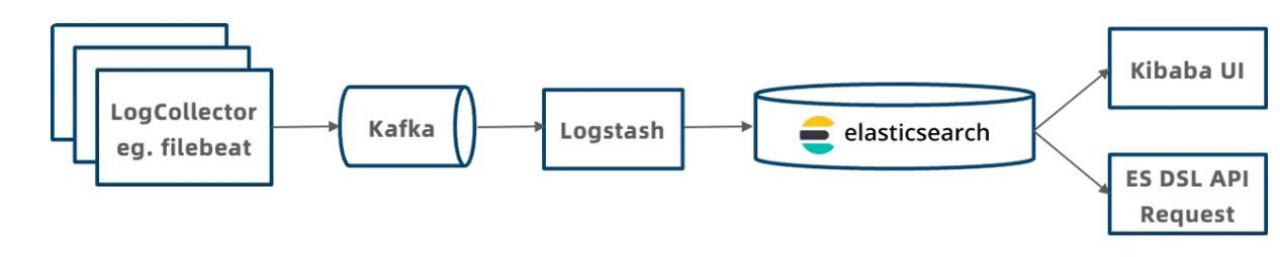
While functional, it suffered from:
- High Resource Consumption: Both data ingestion and queries were CPU-intensive.
- High Storage Costs: Elasticsearch's low compression ratio led to high storage costs.
- Instability: Out Of Memory (OOM) errors occurred frequently during large queries, and it took considerable time to restore services, causing extended downtime.
The next iteration involved Grafana Loki with Cassandra as backend storage.
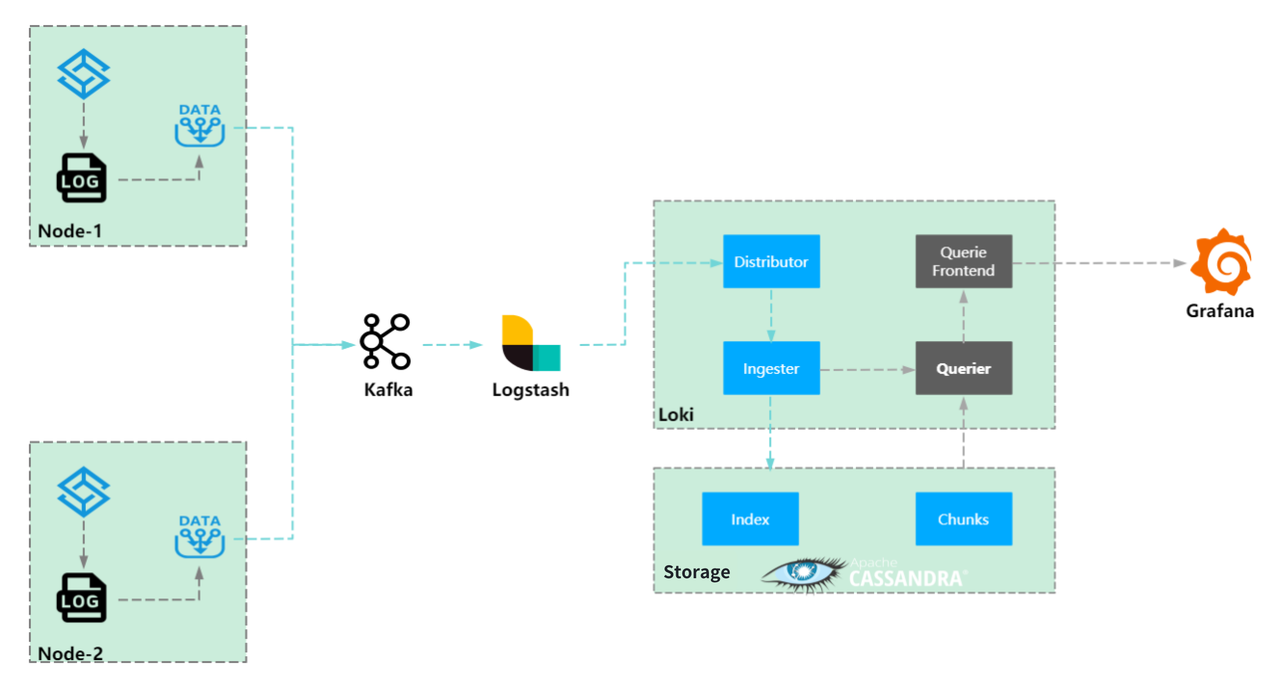
This brought an over 83% decrease in storage costs compared to Elasticsearch. However, new challenges emerged:
- High CPU Utilization & Inefficient Query: Loki's query mechanism (index to chunk, decompress, then brute-force search) often led to high CPU utilization and OOMs.
- Tag Cardinality Limitations: Query speed degraded significantly when querying high-cardinality data, such as trace IDs.
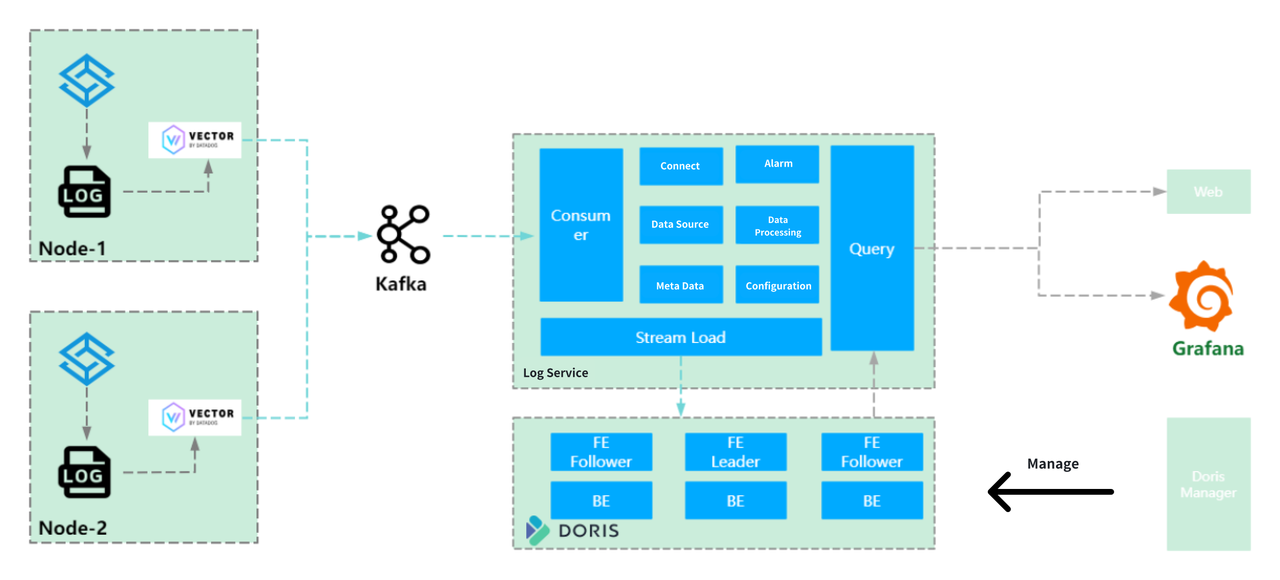
The Search for a Solution: Introducing Apache Doris
To overcome these storage and query performance bottlenecks, the company replaced Loki with Apache Doris. The data flow is similar: data was sent to Kafka, and then processed and batch-loaded into Doris via Stream Load (batched for 3 minutes or 200MB).
Apache Doris is an ideal choice to achieve goals:
- High Write Throughput: Doris now handles 10TB / 60 billion log entries daily.
- Fast Query Performance: Query efficiency skyrockets by at least 10x, especially for aggregations, phrase matching, and TOPN queries. Even non-indexed queries complete within minutes.
- Exceptional Cost-Effectiveness: For the same dataset, Doris reduces storage costs to just 1/6th compared to Elasticsearch.
- Simplified Operations: Doris Manager can manage all clusters. Grafana and the custom Web UI streamline log search and analysis.
The Results: A Transformed Observability Landscape
The migration to Apache Doris delivers significant improvements:
- High Throughput & Query Performance:
- Handles 10TB of data and 60 billion log entries daily.
- Achieves a 10x improvement in query speed.
- Drastic Cost Reduction:
- Reduces storage consumption by 83% compared to Elasticsearch.
- Enhanced Flexibility & Efficiency:
- Doris's data models (Unique Key for traces/configs, Duplicate Key for raw logs, and Aggregate Key for pre-aggregated metrics) are optimized for specific observability data types.
- Doris's
VARIANTdata type handles dynamic and nested JSON data better, providing dynamic schemas with high performance. This is a significant improvement over tedious manualjson_pathconfigurations. - Table partitioning and bucketing optimizations, along with write tuning (including pre-batching and time-series compaction), improve data ingestion and query performance with minimal resource utilization. For example, a 3-node cluster can ingest 6 million logs (4.5GB) per minute with average disk IO under 9%, BE memory of 4GB, and CPU utilization at 9%.
- Simplified Management & User Experience:
- Doris Manager streamlines the administration of dozens of clusters.
- Familiar SQL interface and integration with Grafana optimize user experience.
This leading AI and Speech Technology company plans to further leverage Apache Doris:
- Explore AIOps capabilities with their proprietary large language models.
- Enhance user behavior analysis with automated materialized views.
- Adopt Doris 3.0's separation of storage and computation for centralized read/write splitting and tenant isolation.
Talk to Us
If you want to bring similar (or even higher) performance improvements and benefits to your data platform, or just explore further on Apache Doris, you are more than welcome to join the Apache Doris community, where you can connect with other users facing similar challenges and get access to professional technical advice and support.
If you're exploring fully-managed, cloud-native options, you can reach out to the VeloDB team!