A side-by-side comparison of observability solutions in terms of performance, cost, usability, and ecosystem openness. This article also introduces Apache Doris as a powerful observability solution, supported by live demos and real-world user success stories.
Observability is like giving your system a "glass box", so you can see what’s happening inside just by looking at the data it gives off.
An observability platform collects and analyzes three key types of signals:
- Logs (what happened)
- Traces (how requests flow)
- Metrics (how it’s performing)
Together, these help teams understand the health of complex, distributed systems, like having a real-time dashboard for your car’s engine. With this, you can:
- Spot problems early (alerts)
- Find the root cause quickly (debugging)
- Optimize resource use (performance tuning)
...all leading to more reliable systems and a better user experience.
Why observability matters
Today's IT environments, especially in cloud-native and microservices architectures, are far more intricate than before. A GenAI application request might traverse dozens of components, including app frontends, service gateways, auth systems, billing services, AI Agent, RAG engines, vector databases, distributed caches, message queues, LLM APIs, and more. In such environments, traditional troubleshooting methods, like SSH into servers to check logs, are no longer effective. That's when an observability platform comes in handy. It offers a unified way to collect, store, and analyze logs, traces, and metrics, enabling teams to detect and resolve issues faster. What's more, in the AI era, App and Agents will generate much more telemetry data than ever before.
Meanwhile, user expectations for uptime and performance are higher than ever. Downtime impacts both user trust and business revenue. With full-stack data correlation and end-to-end visual analysis, observability empowers teams to pinpoint root causes quickly, minimize service disruptions, and even anticipate bottlenecks before failures occur. In short, observability is no longer optional. It’s a foundation for operational excellence and innovation.
Choosing the right observability solution: what to look for
Picking an observability solution is all about handling huge volumes of fast-moving data. To do that well, the platform needs to tackle five major technical challenges:
01 Storing massive data with cost sensitivity
Observability data, especially logs and traces, can easily reach 100 TB to petabytes per day in large enterprises. Since compliance or business needs may require storing this data for months, total storage can hit PB to EB levels. But here's the catch: the value of the data drops over time, so storage must be cheap and scalable, like archiving tons of receipts you may only occasionally revisit.
02 Real-time ingestion with high throughput
A good observability system needs to ingest millions of records per second, with sustained 1~10 GB/s write speeds, and do it in real-time. Why? Because when something breaks, you can’t wait hours to see what went wrong. The data needs to be queryable within seconds of arrival.
03 Real-time query response with full-text search support
Observability data is rich in text. The platform must support full-text search with high speed and low latency, even as new data pours in constantly. It is hard to achieve real-time responsiveness with traditional full-table scans and string matching methods, because they often fall short in performance and scalability under heavy data loads.
04 Flexible and evolving schema
Log data typically starts as unstructured raw text and gradually evolves into semi-structured formats—most commonly JSON-based logs and traces. These JSON structures often change over time, with fields being added or removed dynamically. Traditional databases and data warehouses struggle to accommodate this level of schema variability. While data lakes offer the flexibility to store such dynamic data, they often fall short in terms of processing performance and real-time analytics capabilities required for observability use cases.
05 Open ecosystem and integration readiness
Observability doesn’t live in a silo. It needs to connect to multiple data sources and tools like OpenTelemetry, Grafana, Kibana, and more. An observability solution must support a broad ecosystem and allow seamless integration for collection, visualization, and alerting.
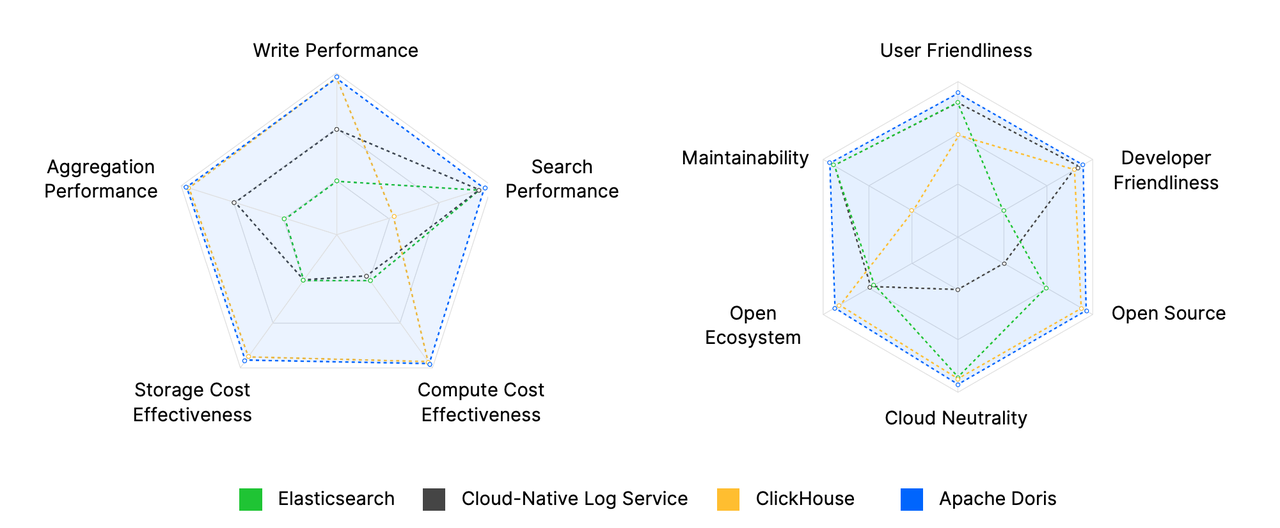
Comparison of popular observability solutions
The observability solution landscape is highly diverse, with options ranging from Elasticsearch, ClickHouse, and Apache Doris to offerings from major cloud providers. This is a side-by-side comparison of them in terms of performance, cost, ease of use, and openness.
Performance
This includes write performance and query performance.
- Elasticsearch is well-known for its inverted indexing and full-text search capabilities, responding to searches within seconds. However, it struggles with high-throughput ingestion, often experiencing write rejections and latency spikes under load. Its performance on aggregation and analytical queries is also limited.
- Apache Doris combines columnar storage with a vectorized execution engine and enhances inverted index performance specifically for observability use cases. It outperforms Elasticsearch with 5x faster writes, 2x faster queries, and 6~21x better aggregation performance.
- ClickHouse also excels in write throughput and aggregation through its columnar and vectorized engine. However, its full-text search performance lags significantly—often by orders of magnitude—compared to Elasticsearch or Apache Doris, and remains in an experimental phase.
- Cloud log services offer strong write and query performance backed by extensive infrastructure, but they often come with high operational costs, which must be carefully weighed.
Cost
This includes storage costs and computing costs.
- Elasticsearch is notorious for its cost overhead. It stores raw rows, inverted indexes, and
doc_valuecolumnar data, but achieves only 1.5:1 compression. Its reliance on the JVM and the high CPU load from index building make both storage and compute expensive. For a workload that generates 100TB of observability data per day, with 30 days of total data retention and 3 days kept as hot (frequently accessed) data, the cost of using Elasticsearch is estimated to be around $200,000/monthly. - Apache Doris is optimized for observability workloads. It delivers 50~80% cost savings over Elasticsearch. Combining optimized inverted indexing, columnar storage, and ZSTD, it can deliver a compression ratio of 5:1 to 10:1, along with tiered storage for further cost reduction. On the write side, it reduces CPU and disk overheads by techniques like single-replica ingestion, time-series data compaction, and vectorized index building. To provide a more straightforward comparison: VeloDB Cloud, the cloud-native commercial offering of Apache Doris, costs around $27,000/month under the same workload.
- ClickHouse also offers relatively low storage and compute costs, leveraging its columnar engine and vectorized execution.
- Cloud log services offer convenience and scalability, but their costs are also high, roughly $190,000/month for the same scale.
Ease of use (manageability & usability)
Observability platforms deal with massive data volumes, so they typically adopt distributed architectures. Scalability depends heavily on how easily the system can be deployed, scaled, upgraded, and managed. Meanwhile, developer efficiency and user experience are largely shaped by the system interface.
- Elasticsearch (or the ELK stack) offers a user-friendly UI via Kibana, but its complex DSL query language makes development and integration difficult.
- Apache Doris delivers an interactive analytics experience similar to Kibana and supports native integration with Grafana. It uses standard SQL and is MySQL-compatible, making it accessible to most developers and analysts. Apache Doris features a simplified architecture that’s easy to deploy and scale—with online scaling, automatic load balancing, and a visual Cluster Manager.
- ClickHouse provides a SQL interface but uses custom syntax. Operations are more complex due to distinct exposed concepts like local vs. distributed tables and the lack of auto-rebalancing, often requiring a custom cluster management layer.
- Cloud log services provide SaaS ease-of-use—no infrastructure to manage, but often at a higher cost and with less flexibility.
Openness (open source & multi-cloud neutrality)
When building an observability platform, it’s also important to assess the risk of vendor lock-in. The degree of open-source adoption, multi-cloud support, and ecosystem openness all directly impact the platform’s flexibility and long-term viability.
- Elasticsearch offers both open-source and commercial versions across major clouds, but its tightly-coupled ELK stack limits interoperability. For example, Kibana only works with Elasticsearch and is difficult to extend beyond that ecosystem.
- Apache Doris is a top-level Apache project. Its commercial version, VeloDB, is available across major global cloud platforms, including AWS, Azure, and GCP. Both Apache Doris and VeloDB integrate smoothly with open observability tools like OpenTelemetry, Grafana, and Kibana, while maintaining ecosystem neutrality and openness.
- ClickHouse also supports both open-source and commercial editions across clouds and integrates with open tools like Grafana and OpenTelemetry. However, its acquisition of an observability-focused company may lead to tighter ecosystem coupling and reduced neutrality.
- In contrast, cloud log services are closed-source and tightly bound to their respective cloud platforms, making it difficult to ensure consistent cross-cloud experiences or migrate easily between providers.
Apache Doris-powered observability
Built on a foundation of MPP-based architecture, a vectorized execution engine, and a cost-based optimizer (CBO), Apache Doris is well-suited for a variety of workloads—including observability, where it adds support for inverted indexes and ultra-fast full-text search. These drive optimization in both write throughput and storage efficiency, enabling users to build observability systems that are high-performance, cost-effective, and open.
Architecture overview
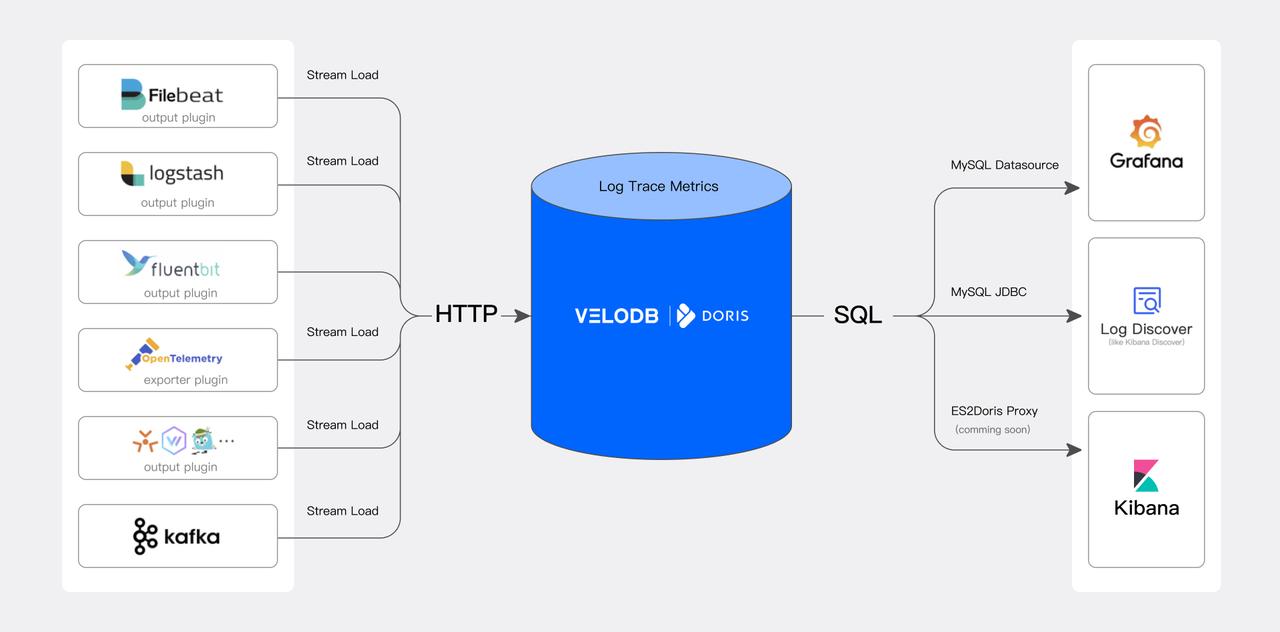
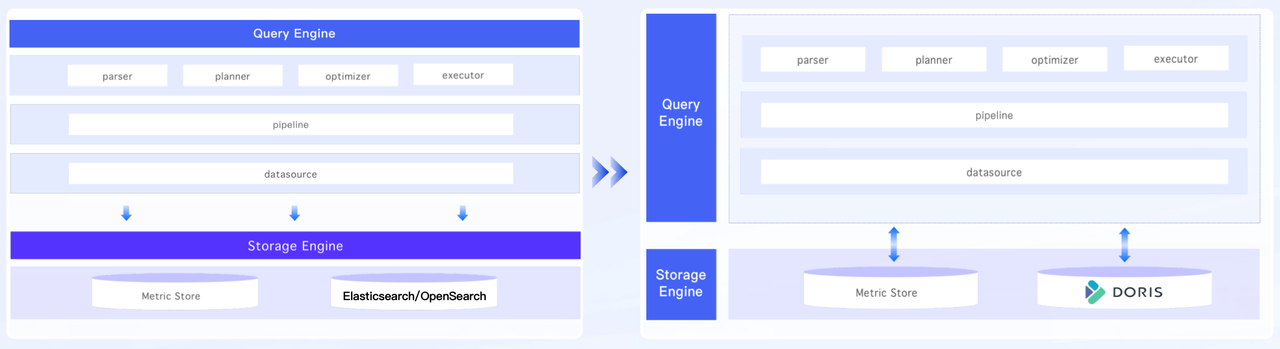
A Apache Doris-based observability platform consists of three core layers:
01 Data ingestion and preprocessing
Apache Doris supports a wide range of data collection tools from the observability ecosystem, including OpenTelemetry, Logstash, and Filebeat from the ELK stack. Logs, traces, and metrics can be ingested via standard HTTP APIs.
02 Data storage and analytical engine
Powered by Apache Doris, this is a unified, high-performance, and cost-efficient storage layer for observability data, where users can query and analyze data efficiently and flexibility through a standard SQL interface.
03 Query analysis and visualization
Apache Doris integrates seamlessly with popular visualization and monitoring tools such as Grafana and Kibana. Users can easily perform log searches, run analysis, create alerts, and build real-time dashboards for proactive monitoring and rapid response.
Apache Doris brings industry-leading performance and cost-efficiency to observability workloads, making it an ideal engine for storing and analyzing logs, traces, and metrics at massive scale.
High performance
-
High-throughput, low-latency ingestion Apache Doris supports sustained ingestion at 10 GB/s, handling PB-scale observability data daily while maintaining write latency within seconds or even milliseconds.
-
Blazing-fast full-text search and inverted indexing Designed for log-heavy scenarios, Apache Doris offers native inverted indexes and high-speed full-text search capabilities. Keyword queries return results within seconds and deliver 3~10x faster performance than ClickHouse in benchmarks and real-world use cases.
-
Massively parallel aggregation and analysis
Built on an MPP architecture with a vectorized pipeline execution engine, Apache Doris fully exploits distributed resources and multi-core CPUs. It ranks among the top performers on ClickBench, making it a strong fit for trend analysis, alerting, and other common observability queries.
Low cost
-
High compression and cost-efficient storage
Apache Doris handles PB-scale data retention with compression ratios of 5:1 to 10:1 or higher (indexes included). Compared to Elasticsearch, it reduces storage costs by 50%~80%. Further savings are possible by offloading cold data to S3 or HDFS, which cuts long-term storage costs by another 50%.
-
Resource-efficient ingestion
Under the same ingest load, Apache Doris uses at least 70% less CPU resources compared to Elasticsearch.
Flexible schema
-
Top-level schema changes
Apache Doris supports Light Schema Change, where users can add or drop columns and indexes with commands like
ADD/DROP COLUMNandADD/DROP INDEX. These operations complete in seconds, so users can simply focus on indexing just the fields that matter today. -
Internal field evolution
For semi-structured JSON data, Apache Doris provides the
VARIANTdata type. It automatically detects field names and types, and promotes frequently used JSON keys into separate columns for efficient columnar storage, improved compression, and faster querying. Unlike Elasticsearch’s Dynamic Mapping,VARIANTsupports changing field types gracefully as data evolves.
Ease of Use
-
Standard and easy-to-use SQL interface
Apache Doris supports standard SQL and is fully compatible with the MySQL protocol and syntax. This allows both engineers and data analysts to query observability data using straightforward SQL.
-
Seamless integration with the observability ecosystem
Compatible with OpenTelemetry and the ELK ecosystem, Apache Doris integrates smoothly with visualization tools like Grafana and Kibana.
-
Operational simplicity
Apache Doris supports online scaling and auto-rebalancing without service interruption. For private deployments, VeloDB offers a visual Cluster Manager and a Kubernetes Operator — both are free to download for Apache Doris users. For the cloud-native solution, users benefit from a fully managed, out-of-the-box experience that eliminates operational overhead.
Openness and cloud neutrality
-
Open source
Apache Doris is a top-level Apache project adopted by over 5000 companies worldwide, supporting OpenTelemetry, Grafana, and other observability ecosystems.
-
Cloud-agnostic deployment
VeloDB Cloud, the cloud-native enterprise-grade offering based on Apache Doris, is available across major global cloud platforms (AWS, Azure, GCP, etc.), delivering a consistent experience across different cloud environments.
Demo & Screenshot
In this demo, we demonstrate the observability capabilities of Apache Doris.
As shown in the video, the system under observation is a simulated e-commerce website composed of over a dozen microservices. A load generator continuously sends requests to the entry service, generating large volumes of observability data (logs, traces, and metrics) throughout the entire system.
Such data is collected via various language SDKs provided by OpenTelemetry and sent to the OpenTelemetry Collector, where the processors perform pre-processing. The processed data is then written into Apache Doris using the OpenTelemetry Doris Exporter, and finally visualized and analyzed through Grafana.
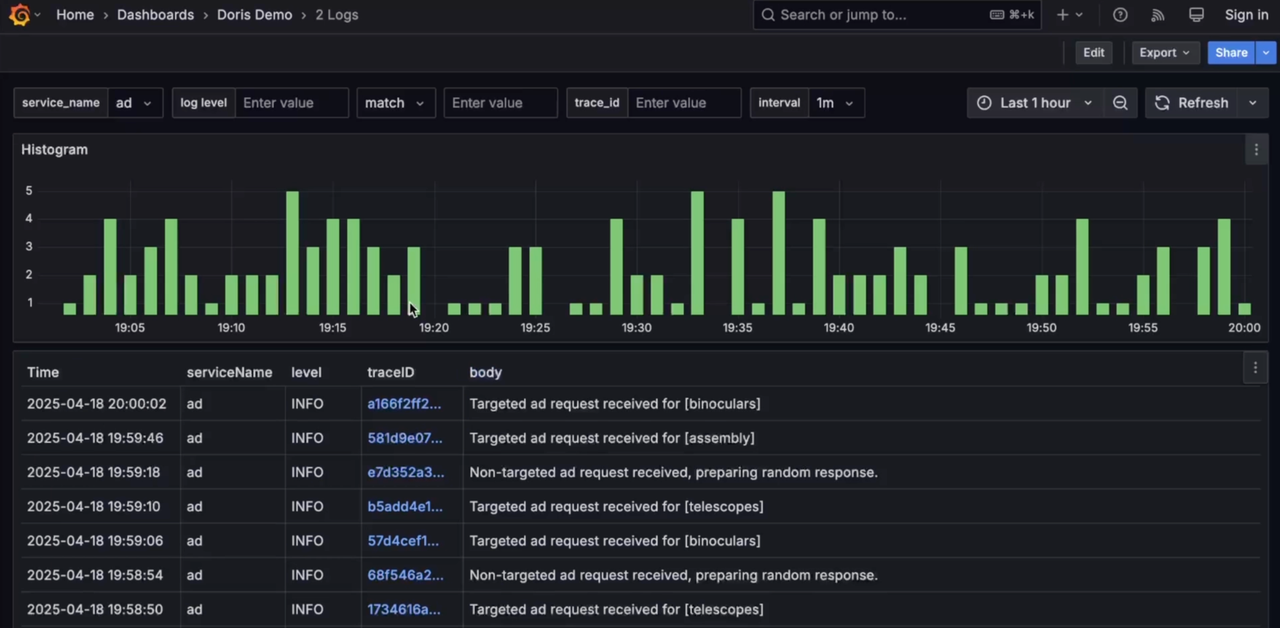
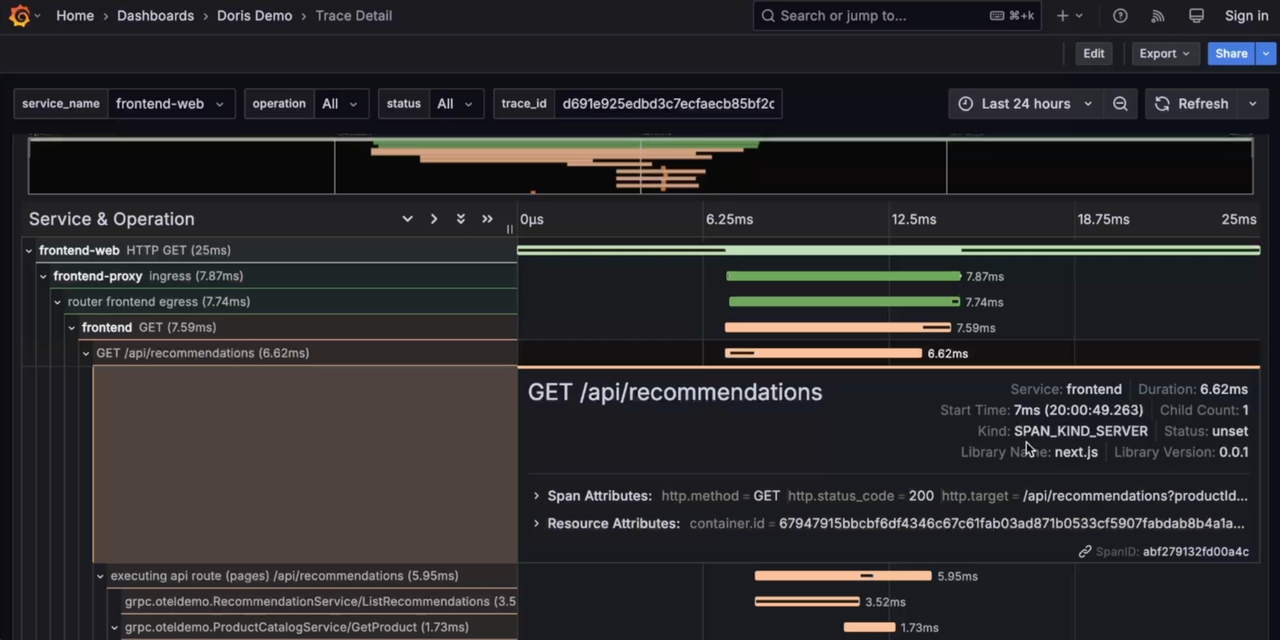
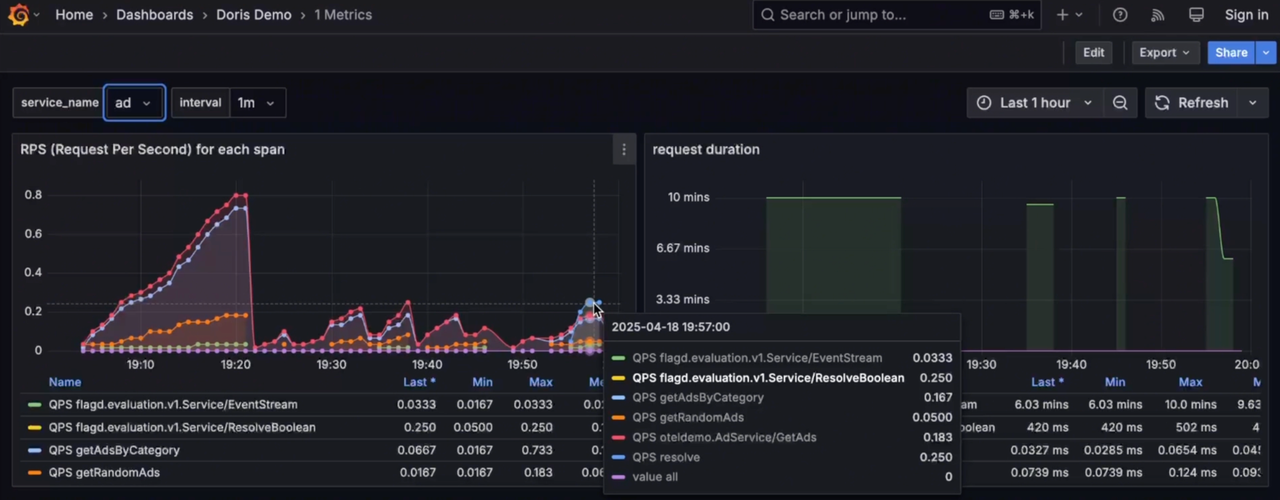
Grafana connects to Apache Doris via the MySQL datasource, enabling unified visualization and analysis across logs, traces, and metrics (including correlation between logs and traces).
-
Logs
-
Traces
-
Metrics
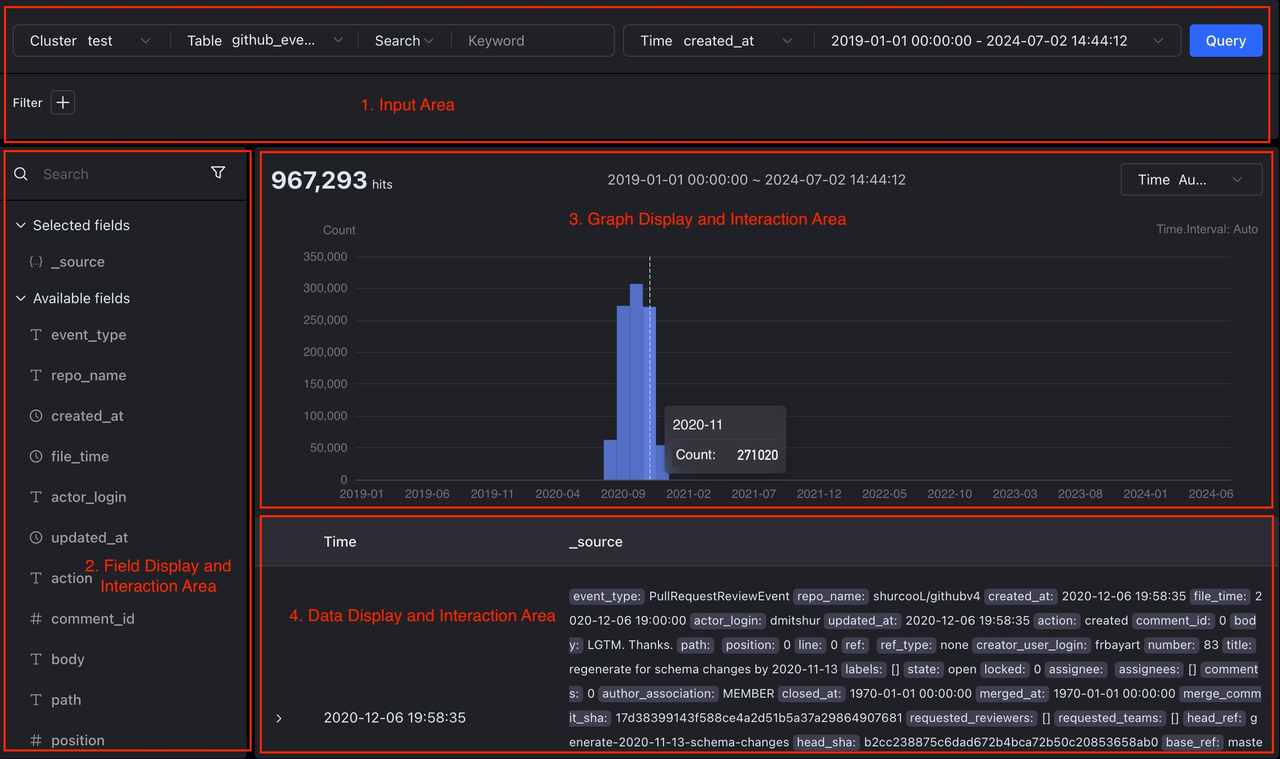
While Grafana's built-in log analysis capabilities are relatively basic compared to Kibana, VeloDB Studio fills that gap by offering powerful log search and analytics similar to Kibana Discover. This log exploration capability will soon be integrated directly into the Grafana Doris datasource.
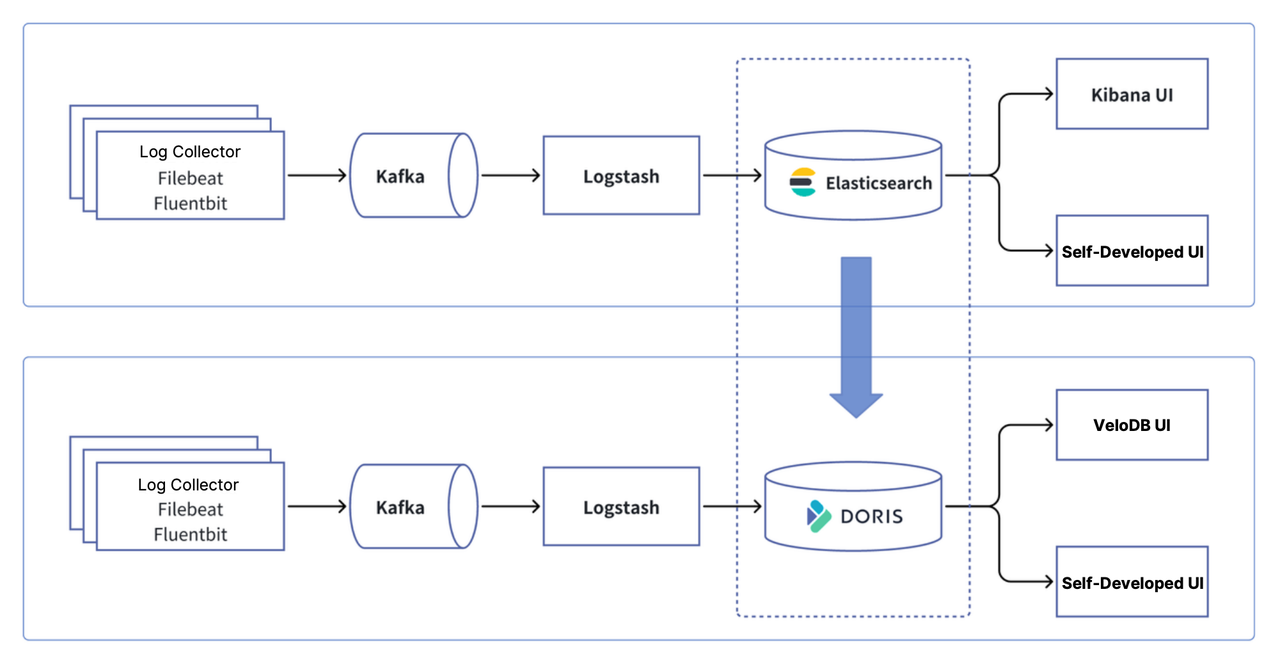
Upcoming enhancements will add Elasticsearch protocol compatibility, allowing native Kibana integration with Apache Doris. This will enable ELK users to seamlessly replace Elasticsearch with Doris—preserving existing logging and visualization workflows while dramatically lowering costs and boosting performance.
User stories
A SaaS observability platform
GuanceDB has replaced cloud-hosted Elasticsearch with Apache Doris to power its observability and log analytics platform. Leveraging Apache Doris' inverted index, VARIANT data type, and tiered storage, GuanceDB has achieved a 70% reduction in storage costs while boosting query performance by 2~4x. The result is a 10x improvement in overall cost-performance.
A commercial bank (with total assets of 1.4 trillion USD)
To ensure business continuity, improve ops efficiency, and meet strict financial audit requirements, CITIC Bank built a massive cloud-native log analytics platform. It supports real-time monitoring, incident diagnosis, and regulatory log auditing at scale, with daily log ingestion exceeding 100+ TB and full archive volumes reaching petabyte scale.
Initially built on Elasticsearch, the platform faced challenges: high storage costs, slow real-time ingestion, poor full-text search performance, and limited analytics capabilities. By migrating to Apache Doris, CITIC Bank reduced infrastructure costs by 50%, improved query speeds by 2~4x, and significantly streamlined operations.
MiniMax (Creator of Talkie)
MiniMax has adopted Apache Doris to build a unified observability platform. The system handles a total data volume of around 10TB, with hundreds of terabytes of new log data ingested daily.
In real-world workloads, the platform delivers P95 query latency under 3 seconds, and at peak times, sustains read/write throughput over 10 GB/s.
To achieve this level of performance and scale efficiently, MiniMax leverages features in Apache Doris, including compute-storage decoupling, compression algorithms, and hot data caching with a single replica. These optimizations have led to a 40% reduction in compute resource usage and 50% savings in hot data storage.
What's next
Apache Doris enables users to build observability platforms that outperform Elasticsearch by up to 10x.
And that’s just the beginning. Apache Doris is continuously evolving its core observability engine and ecosystem. In the coming months, we’re rolling out several major enhancements:
- Apache Doris will support Kibana’s native visualization through the es2doris proxy. Combined with the existing Logstash Doris Output Plugin, it will enable Elasticsearch users to switch without changing existing pipelines.
- Grafana users will soon gain access to an enhanced search experience with built-in support for Apache Doris and Kibana-style interactive log analysis, directly within Grafana.
- We’re extending our search capabilities with support for more analyzers such as IK, ICU, and Edge NGram, while enabling custom analyzer combinations for more tailored search scenarios.
- We’re enhancing VARIANT to support merged storage of infrequent fields and allow users to explicitly define types and indexing options per field. This will be perfect for handling dynamic, JSON-style log data efficiently.
If you're interested in Apache Doris as an observability solution, you are more than welcome to join the Apache Doris community, where you can connect with other users facing similar challenges and get access to professional technical advice and support.
If you're exploring fully-managed, cloud-native options, you can reach out to the VeloDB team.