What is Opentelemetry
1. Introduction / Background
OpenTelemetry is a 100% free and open-source observability framework designed to provide comprehensive telemetry data collection, processing, and export capabilities for modern distributed systems. Born as a merger of OpenTracing and OpenCensus projects in 2019, OpenTelemetry has become the industry standard for observability instrumentation under the Cloud Native Computing Foundation (CNCF). As organizations increasingly adopt microservices, containerized applications, and cloud-native architectures, OpenTelemetry addresses the critical need for unified observability across complex distributed systems by providing standardized APIs, SDKs, and tools for generating, collecting, and exporting traces, metrics, and logs without vendor lock-in.
2. Why Do We Need OpenTelemetry?
Modern distributed systems and cloud-native architectures create significant observability challenges that traditional monitoring approaches cannot effectively address:
- Observability Fragmentation: Different monitoring tools and vendors create data silos, making it difficult to correlate events across the entire system stack
- Vendor Lock-in Concerns: Proprietary instrumentation libraries tie applications to specific monitoring platforms, limiting flexibility and increasing costs
- Instrumentation Overhead: Adding observability to applications often requires extensive custom code and multiple SDK integrations for different data types
- Cross-Service Correlation: Tracking requests across multiple microservices, containers, and cloud platforms requires sophisticated distributed tracing capabilities
- Inconsistent Data Formats: Various monitoring tools use different data schemas and formats, complicating data analysis and toolchain integration
- Manual Instrumentation Burden: Developers spend significant time implementing custom observability code instead of focusing on business logic
OpenTelemetry addresses these challenges by providing:
- Unified Observability Framework with standardized APIs and SDKs for traces, metrics, and logs
- Vendor Neutrality enabling data export to any observability backend without vendor lock-in
- Automatic Instrumentation with minimal code changes for popular frameworks and libraries
- Distributed Context Propagation enabling complete request tracing across service boundaries
- Standardized Data Models ensuring consistent telemetry data formats across all telemetry types
- Ecosystem Integration with seamless support for existing monitoring tools and platforms
3. OpenTelemetry Architecture and Core Components
Overall Architecture
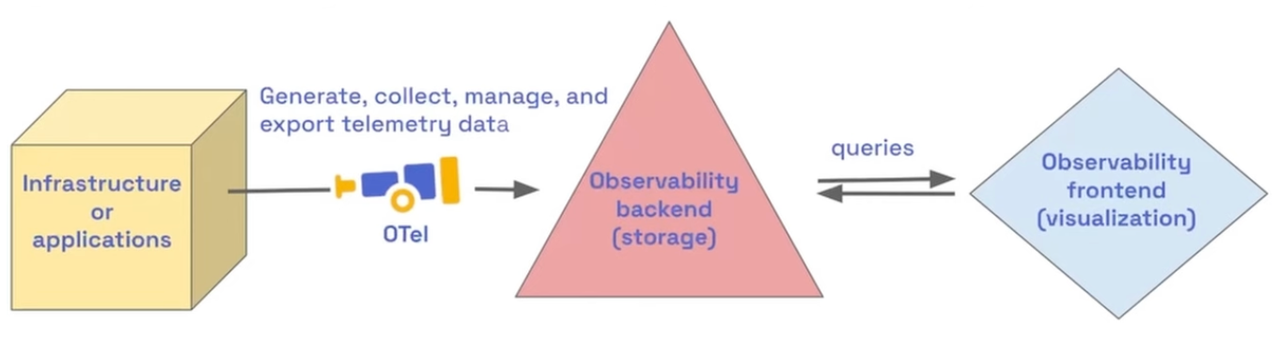
OpenTelemetry employs a pipeline-based architecture where telemetry data flows from instrumented applications through collectors for processing and finally to observability backends, ensuring vendor-neutral data collection and flexible routing capabilities.
Key Components
3.1 OpenTelemetry SDKs
- Language-Specific Libraries: Comprehensive SDKs available for Java, Python, Go, JavaScript, C#, Ruby, and other languages
- Automatic Instrumentation: Zero-code instrumentation for popular frameworks like Spring Boot, Django, Express.js, and ASP.NET
- Manual Instrumentation APIs: Fine-grained control for custom telemetry data collection and context management
- Resource Detection: Automatic detection and attribution of telemetry data to specific services, environments, and infrastructure
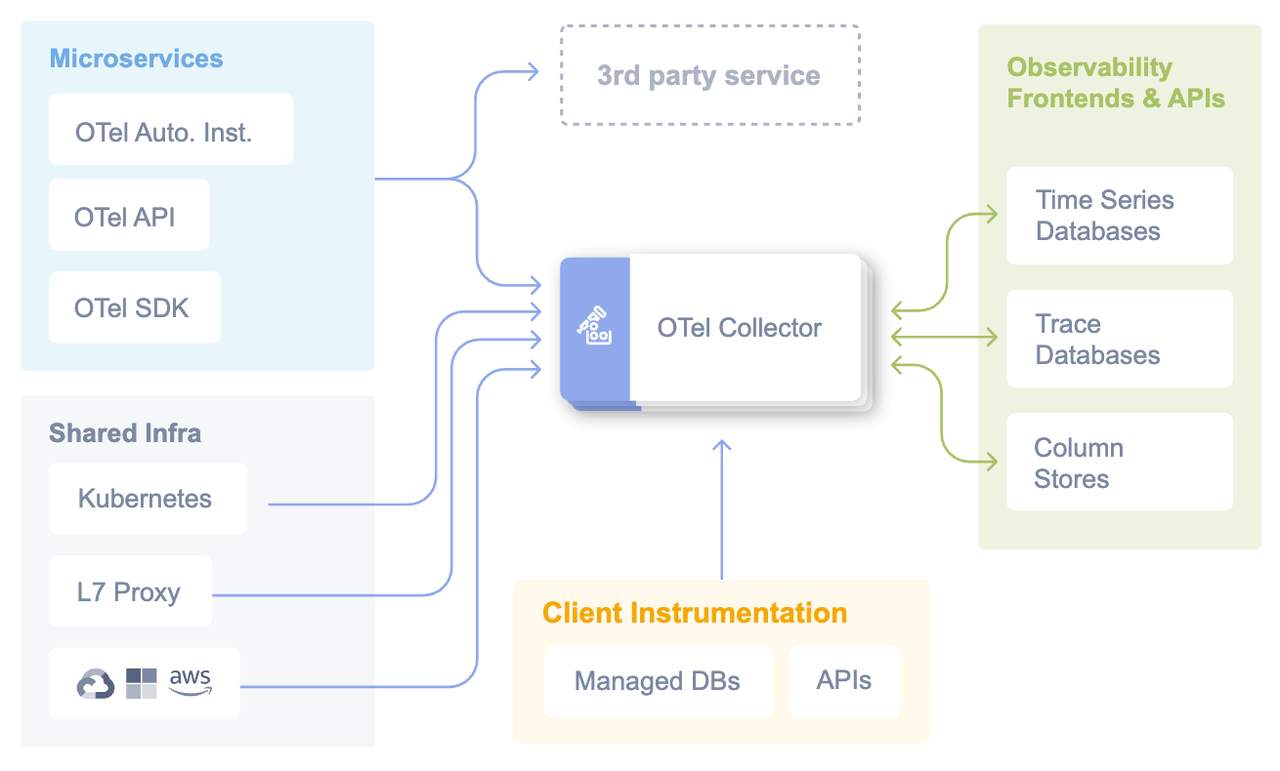
3.2 OpenTelemetry Collector
- Telemetry Pipeline: Vendor-agnostic proxy that receives, processes, and exports telemetry data through configurable pipelines
- Receivers: Input components supporting OTLP, Jaeger, Zipkin, Prometheus, and custom protocols
- Processors: Data transformation components for batching, sampling, filtering, and enrichment
- Exporters: Output components for sending data to observability backends like Jaeger, Prometheus, and cloud services
3.3 OpenTelemetry Protocol (OTLP)
- Standardized Communication: Native protocol for efficient telemetry data transmission between components
- Transport Flexibility: Support for gRPC/protobuf and HTTP/JSON transport mechanisms
- Schema Definition: Protocol Buffers schema ensuring consistent data structures across implementations
- Compression and Batching: Optimized data transmission with compression and batching capabilities
3.4 Instrumentation Libraries
- Framework Integration: Pre-built instrumentation for databases, HTTP clients, message queues, and cloud services
- Semantic Conventions: Standardized attribute naming and data structures for consistent telemetry across different systems
- Context Propagation: Distributed tracing context management across service boundaries and asynchronous operations
- Sampling Strategies: Configurable sampling policies for managing telemetry data volume and costs
4. Key Features and Characteristics
Unified and Standardized Data Collection:
- Three Pillars of Observability: OpenTelemetry unifies the collection of the three main types of telemetry data
- Traces: Represent the flow of a single request or operation through a distributed system. Traces are made up of "spans," which represent individual operations, helping to visualize the path of a request across different services.
- Metrics: Numerical data points measured over time, such as counters, gauges, and histograms. They provide insights into system performance, resource utilization, and other quantitative aspects.
- Logs: Records of discrete events that occur within an application or system. Logs are essential for providing context for errors and debugging.
- Consistency: It provides a standardized approach to collecting and transmitting this data, eliminating the need to use different tools and formats for each type of telemetry.
Vendor-Agnostic and Portable:
- No Vendor Lock-in: One of the most significant advantages of OpenTelemetry is its vendor neutrality. It allows you to collect data once and send it to various observability backends, whether they are open-source (like Jaeger and Prometheus) or commercial (like Datadog, Splunk, or Dynatrace).
- Portability: This flexibility means you can switch observability tools without having to re-instrument your applications, which saves time and effort. It also allows different teams to use their preferred analysis tools.
Open Source and Community-Driven:
- Cloud Native Computing Foundation (CNCF): OpenTelemetry is a CNCF project, which ensures it is developed in the open and is backed by a broad community of industry leaders.
- Active Development: The open-source nature means it is constantly evolving and improving, with a wealth of resources and support available from the community.
Comprehensive Toolkit:
- APIs: Provide a standard way for developers to instrument their applications to capture logs, metrics, and traces.
- SDKs: Language-specific kits that implement the OpenTelemetry specification and APIs, allowing for configuration and fine-tuning of data collection.
- OpenTelemetry Collector: An agent that can receive, process, and export telemetry data from various sources to different backends. It acts as an intermediary, providing a single point for data management and allowing for filtering, enrichment, and batching of data.
- Semantic Conventions: A set of standardized naming schemes and attributes for common telemetry data types. This ensures consistency and interoperability across different languages and services.
- Automatic Instrumentation: Supports various components that can automatically generate telemetry data from popular libraries and frameworks, often without requiring code changes.
Flexibility and Scalability:
- Modular Architecture: The components are loosely coupled, allowing you to choose and integrate only the parts you need.
- Flexible Data Handling: The Collector provides powerful capabilities for processing and exporting data, enabling you to manage data flow and control what information is sent to your monitoring platforms.
- Sampling: Allows you to collect a subset of data rather than every single data point, helping to reduce the load on your system and control costs.
5. Use Cases
5.1 Microservices Observability
Development teams use OpenTelemetry to gain complete visibility into distributed microservices architectures, tracking request flows across service boundaries and identifying performance bottlenecks.
5.2 Cloud-Native Application Monitoring
Platform engineering teams leverage OpenTelemetry for comprehensive monitoring of containerized applications, Kubernetes clusters, and cloud-native infrastructure.
5.3 DevOps and SRE Operations
Operations teams utilize OpenTelemetry for maintaining SLA compliance, incident response, and capacity planning through unified telemetry data collection and analysis.
5.4 AI/ML Workload Observability
Data science and AI teams implement OpenTelemetry to monitor LLM applications, track token usage, monitor model performance, and analyze AI agent behavior.
6. Practical Example
We demonstrate the VeloDB-based observability platform using a comprehensive demo from the OpenTelemetry community.
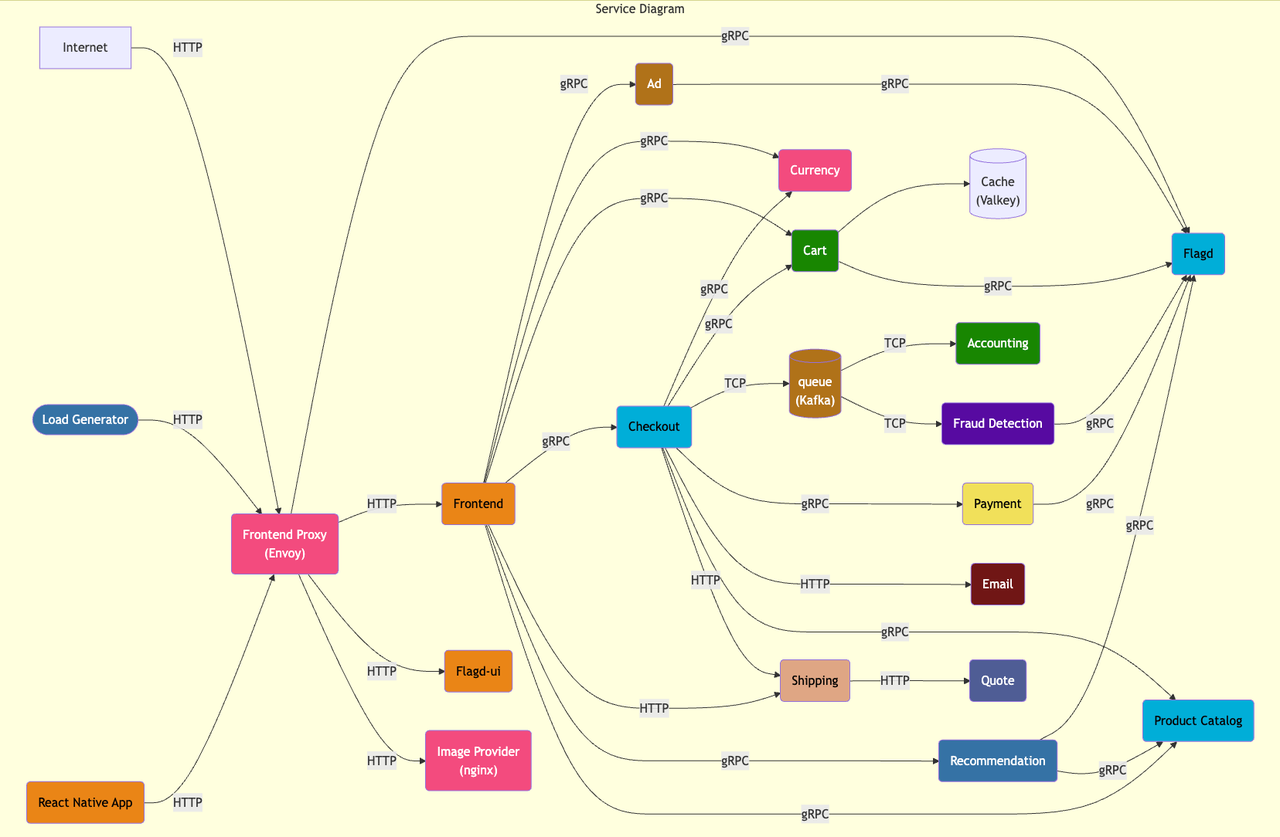
The observed business system simulates an [e-commerce website] (https://opentelemetry.io/docs/demo/architecture/) composed of frontend, authentication, cart, payment, logistics, advertising, recommendation, risk control, and more than ten modules, reflecting a high level of system complexity, thus presenting significant challenges for observability data collection, storage, and analysis.
The Load Generator tool sends continuous requests to the entry service, generating vast volumes of observability data (Logs, Traces, Metrics). These data are collected using OpenTelemetry SDKs in various languages, sent to the OpenTelemetry Collector, preprocessed by Processors, and finally written into VeloDB via the OpenTelemetry Doris Exporter. Observability visualization tools such as Grafana connects to VeloDB through the MySQL interface, providing visualized query and analysis capabilities.
The diagram below provides an overview of the system components, showcasing the configuration derived from the OpenTelemetry Collector (otelcol) configuration file utilized by the OpenTelemetry demo application. Additionally, it highlights the observability data (traces and metrics) flow within the system.
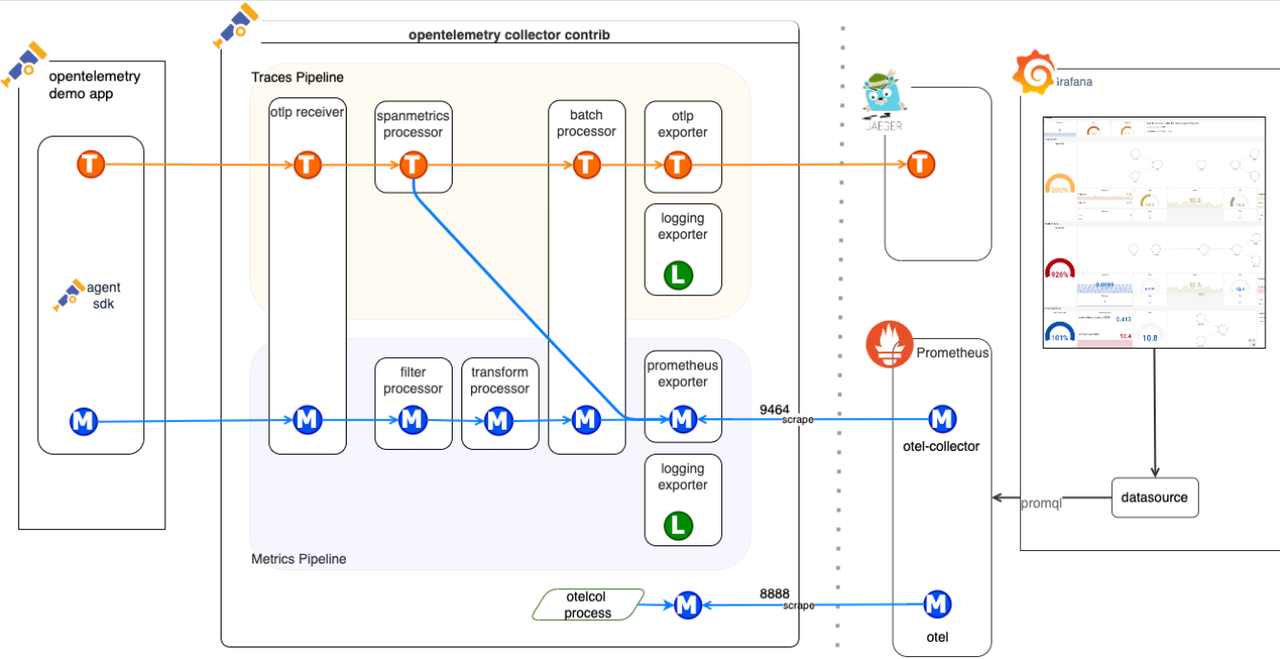
The OpenTelemetry config for this demo is as follows.
receivers:
  otlp:
    protocols:
      grpc:
        endpoint: ${env:OTEL_COLLECTOR_HOST}:${env:OTEL_COLLECTOR_PORT_GRPC}
      http:
        endpoint: ${env:OTEL_COLLECTOR_HOST}:${env:OTEL_COLLECTOR_PORT_HTTP}
        cors:
          allowed_origins:
            - "http://*"
            - "https://*"
  httpcheck/frontend-proxy:
    targets:
      - endpoint: http://frontend-proxy:${env:ENVOY_PORT}
  docker_stats:
    endpoint: unix:///var/run/docker.sock
  redis:
    endpoint: "valkey-cart:6379"
    username: "valkey"
    collection_interval: 10s

exporters:
  otlp:
    endpoint: "jaeger:4317"
    tls:
      insecure: true
  otlphttp/prometheus:
    endpoint: "http://prometheus:9090/api/v1/otlp"
    tls:
      insecure: true
  doris:
    endpoint: "http://doris:8040"
    database: otel
    username: admin
    password:
    table:
      logs: otel_logs
      traces: otel_traces
      metrics: otel_metrics
    create_schema: true
    mysql_endpoint: "doris:9030"
    history_days: 30
    create_history_days: 0
    replication_num: 1
    timezone: Asia/Shanghai
    timeout: 60s
    #log_response: true
    #label_prefix: otel
    headers:
      # load_to_single_tablet: "true"
      max_filter_ratio: "1"
    sending_queue:
      enabled: true
      num_consumers: 10
      queue_size: 1000
    retry_on_failure:
      enabled: true
      initial_interval: 5s
      max_interval: 30s
      max_elapsed_time: 300s

processors:
  batch:
    send_batch_size: 10000
    timeout: 10s
  memory_limiter:
    check_interval: 5s
    limit_percentage: 80
    spike_limit_percentage: 25
  transform:
    error_mode: ignore
    trace_statements:
      - context: span
        statements:
          # could be removed when https://github.com/vercel/next.js/pull/64852 is fixed upstream
          - replace_pattern(name, "\\?.*", "")
          - replace_match(name, "GET /api/products/*", "GET /api/products/{productId}")

connectors:
  spanmetrics:

service:
  pipelines:
    traces:
      receivers: [otlp]
      processors: [memory_limiter, transform, batch]
      exporters: [otlp, debug, spanmetrics, doris]
    metrics:
      receivers: [hostmetrics, docker_stats, httpcheck/frontend-proxy, otlp, redis, spanmetrics]
      processors: [memory_limiter, batch]
      exporters: [doris, otlphttp/prometheus, debug]
    logs:
      receivers: [otlp]
      processors: [memory_limiter, batch]
      exporters: [doris, debug]
  telemetry:
    metrics:
      level: detailed
      readers:
        - periodic:
            interval: 10000
            timeout: 5000
            exporter:
              otlp:
                protocol: grpc
                endpoint: ${env:OTEL_COLLECTOR_HOST}:${env:OTEL_COLLECTOR_PORT_GRPC}
7. Key Takeaways
- OpenTelemetry provides vendor-neutral observability with standardized APIs and protocols for collecting traces, metrics, and logs across distributed systems
- Comprehensive ecosystem support enables automatic instrumentation for popular frameworks and languages while maintaining flexibility for custom implementations
- Collector-based architecture offers scalable data processing pipelines with configurable receivers, processors, and exporters for any observability backend
- Modern 2025 features include enhanced AI/ML observability, Kubernetes integration, and improved performance optimizations for cloud-native environments
- Industry adoption momentum with CNCF graduation status and widespread vendor support making it the de facto standard for observability instrumentation
8. FAQ
Q: What's the difference between OpenTelemetry and traditional observability tools?
A: OpenTelemetry is an instrumentation framework that generates telemetry data, while traditional monitoring tools are backends that store and analyze data. OpenTelemetry can send data to any backend.
Q: Does OpenTelemetry impact application performance?
A: Minimal impact when properly configured. Use sampling strategies, batching, and async exporters to optimize performance. Typical overhead is less than 5% for most applications.
Q: How does OpenTelemetry handle data privacy and security?
A: OpenTelemetry supports TLS encryption, attribute filtering, and sensitive data redaction. Configure processors to remove or mask sensitive information before export.
Q: Can OpenTelemetry work with existing observability solutions?
A: Yes, OpenTelemetry supports numerous exporters for existing tools like Prometheus, Jaeger, Zipkin, Datadog, New Relic, and many others through the collector ecosystem.
9. Additional Resources & Next Steps
Learn More
- What is OpenTelemetry?
- OpenTelemetry Concepts
- OpenTelemetry Language APIs & SDKs
- OpenTelemetry Zero-code Instrumentation
- OpenTelemetry Collector
- OTLP Protocol Specification
- OpenTelemetry Demo
Related Articles
- Observability by Design: Unlocking Consistency with OpenTelemetry Weaver
- Adding Automatic Instrumentation to Your App, Made Easy with the OpenTelemetry Injector
- OpenTelemetry Logging and You
- AI Agent Observability - Evolving Standards and Best Practices
- OpenTelemetry for Generative AI
- An Introduction to Observability for LLM-based applications using OpenTelemetry
- Announcing the OpenTelemetry Demo 2.0
- OpenTelemetry Go 2025 Goals
- Prometheus and OpenTelemetry - Better Together
- Observability at the Edge: New OTel features in Envoy and Istio
Videos
- What is OpenTelemetry?
- Myths and Historical Accidents: OpenTelemetry and the Future of Observability Part 1
- Data by Design: OpenTelemetry and the Future of Observability Part 2
- What OTel is and isn't: OpenTelemetry and the Future of Observability Part 3
- Native OSS instrumentation: OpenTelemetry and the Future of Observability - Part 4
- OTEL in Practice: Filtering & Parsing Data with the OTel Collector
- Demo: Building an Observability Platform with OpenTelemetry, VeloDB, and Grafana
- Trace data analytics: OpenTelemetry and VeloDB
Get Started
Ready to implement standardized observability with OpenTelemetry? Begin with our quickstart guide and start collecting comprehensive telemetry data from your applications and infrastructure.
Unify Your Observability: Deploy OpenTelemetry today and standardize your telemetry data collection with the industry-leading observability framework for modern distributed systems.