What is Grafana
Grafana is an open-source analytics and monitoring platform that provides comprehensive data visualization, dashboards, and alerting capabilities for observability across modern IT infrastructure. Originally developed by Torkel Ödegaard in 2014, Grafana has evolved into the leading solution for creating interactive dashboards that unify metrics, logs, traces, and other data sources into coherent visual narratives. As organizations increasingly adopt cloud-native architectures, microservices, and distributed systems, Grafana serves as the central hub for operational visibility, enabling teams to monitor application performance, infrastructure health, business metrics, and user experience through customizable, real-time dashboards that transform raw data into actionable insights.
2. Why Do We Need Grafana?
Modern organizations face significant challenges in monitoring and understanding their increasingly complex technical and business environments:
- Data Source Fragmentation: Applications and infrastructure generate metrics, logs, and traces across multiple systems, databases, and cloud services, creating visibility silos
- Monitoring Tool Proliferation: Different teams use separate monitoring solutions, leading to inconsistent observability practices and duplicate tooling costs
- Alert Fatigue: Traditional monitoring tools generate excessive false positives and lack intelligent alerting capabilities, reducing team effectiveness
- Limited Visualization Options: Standard monitoring dashboards provide rigid, one-size-fits-all views that don't match specific team needs or use cases
- Operational Blindspots: Without unified dashboards, teams struggle to correlate events across different systems during incidents and troubleshooting
- Business-IT Alignment: Technical metrics often remain isolated from business outcomes, preventing data-driven decision making
Grafana addresses these challenges by providing:
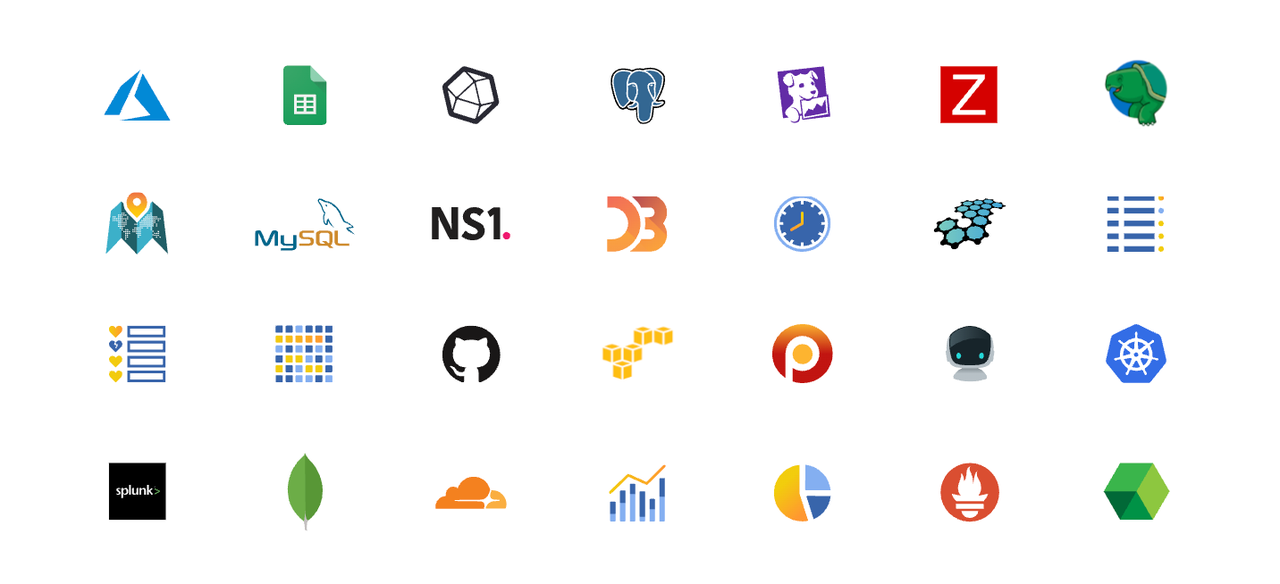
- Unified Data Access connecting to 150+ data sources without requiring data migration or vendor lock-in
- Flexible Visualization with customizable dashboards tailored to specific teams, use cases, and business requirements
- Intelligent Alerting with machine learning-powered anomaly detection and notification routing
- Collaborative Observability enabling teams to share insights, annotate events, and coordinate incident response
- Scalable Architecture supporting enterprise deployments with high availability, authentication, and role-based access control
- Open Source Foundation providing cost-effective monitoring solutions with community-driven innovation
3. Grafana Architecture and Core Components
Overall Architecture
Grafana employs a plugin-based architecture that separates data acquisition, processing, visualization, and alerting into modular components, enabling flexible deployment and customization across diverse environments.
Key Components
3.1 Grafana Server
- Web Application Framework: React-based frontend with Go backend providing REST APIs and WebSocket connections
- Authentication & Authorization: Support for LDAP, OAuth, SAML, and role-based access control (RBAC)
- Session Management: User sessions, API keys, and service account management for secure access
- Dashboard Engine: Template system supporting variables, annotations, and dynamic content generation
3.2 Data Source Plugins
- Time Series Databases: Prometheus, InfluxDB, TimescaleDB, and other TSDB integrations
- Application Performance Monitoring: Jaeger, Zipkin, and distributed tracing systems
- Log Aggregation: Elasticsearch, Loki, Splunk, and centralized logging platforms
- Cloud Services: AWS CloudWatch, Google Cloud Monitoring, Azure Monitor, and cloud-native metrics
3.3 Visualization Engine
- Panel Library: Time series graphs, heatmaps, tables, stat panels, and custom visualizations
- Dashboard Templates: Reusable dashboard components with variable substitution
- Alerting Framework: Query-based alerts with multi-dimensional routing and notification channels
- Annotation System: Event correlation and incident tracking across dashboards
3.4 Plugin Ecosystem
- Community Plugins: Over 150 officially supported and community-contributed plugins
- Custom Development: SDK for building organization-specific data sources and visualizations
- App Plugins: Full-featured applications running within Grafana environment
- Transformation Plugins: Data processing and enrichment capabilities for complex visualizations
4. Key Features and Characteristics
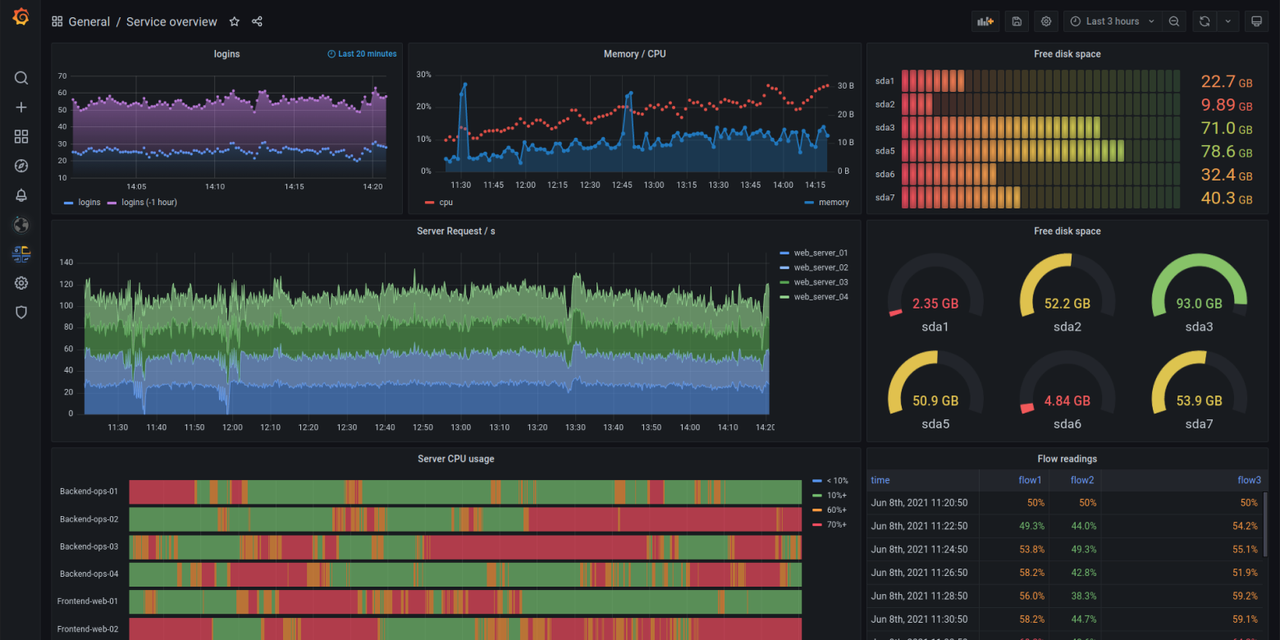
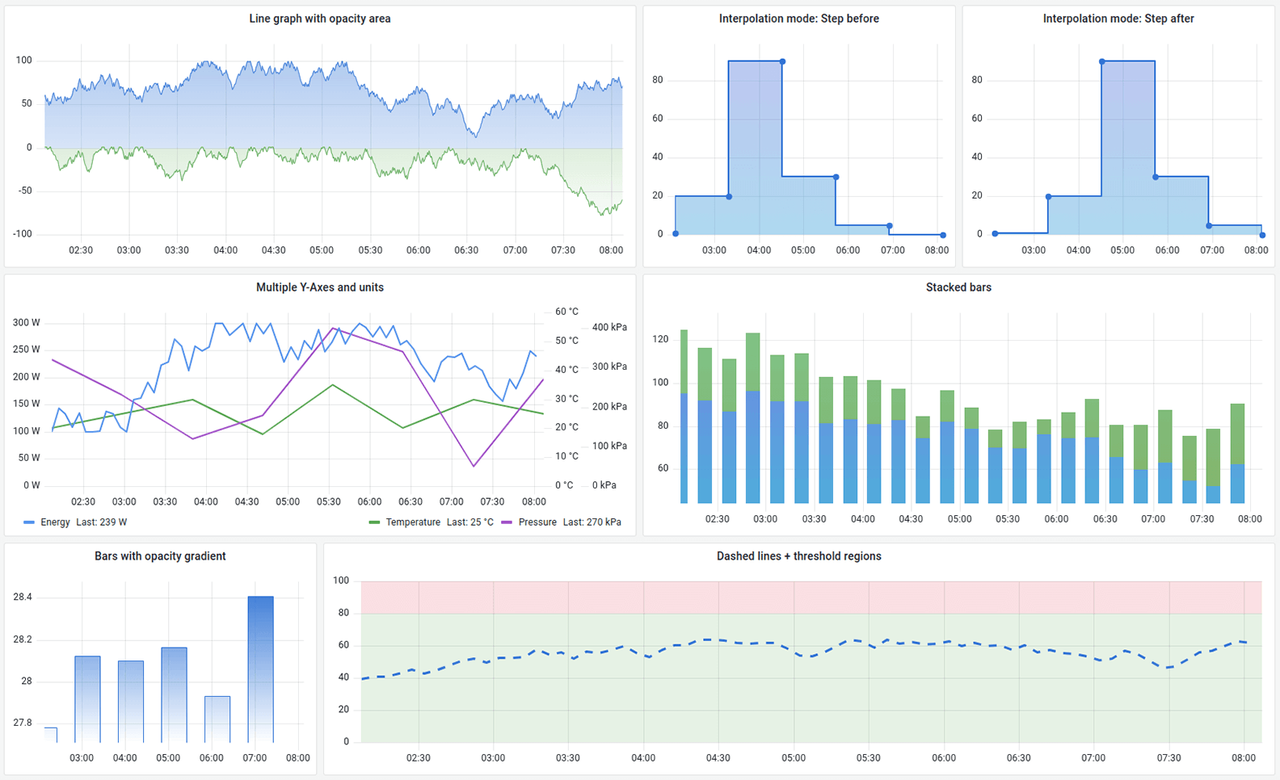
Panels
From heatmaps to histograms. Graphs to geomaps. Grafana has fast and flexible visualizations that allows you to visualize your data, any way you want.
Plugins
Connect your tools and your teams with Grafana plugins. Data source plugins hook into existing data sources via APIs and render the data in real time without requiring you to migrate or ingest your data.
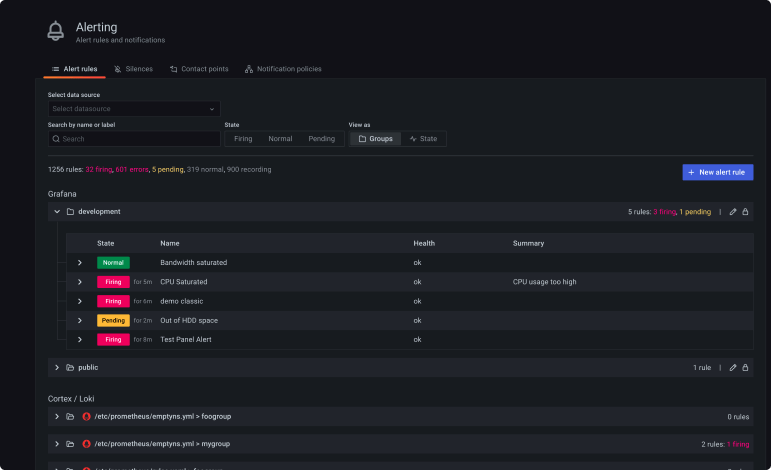
Alerts
With Grafana Alerting, you can create, manage, and silence all of your alerts within one simple UI— allowing you to easily consolidate and centralize all of your alerts.
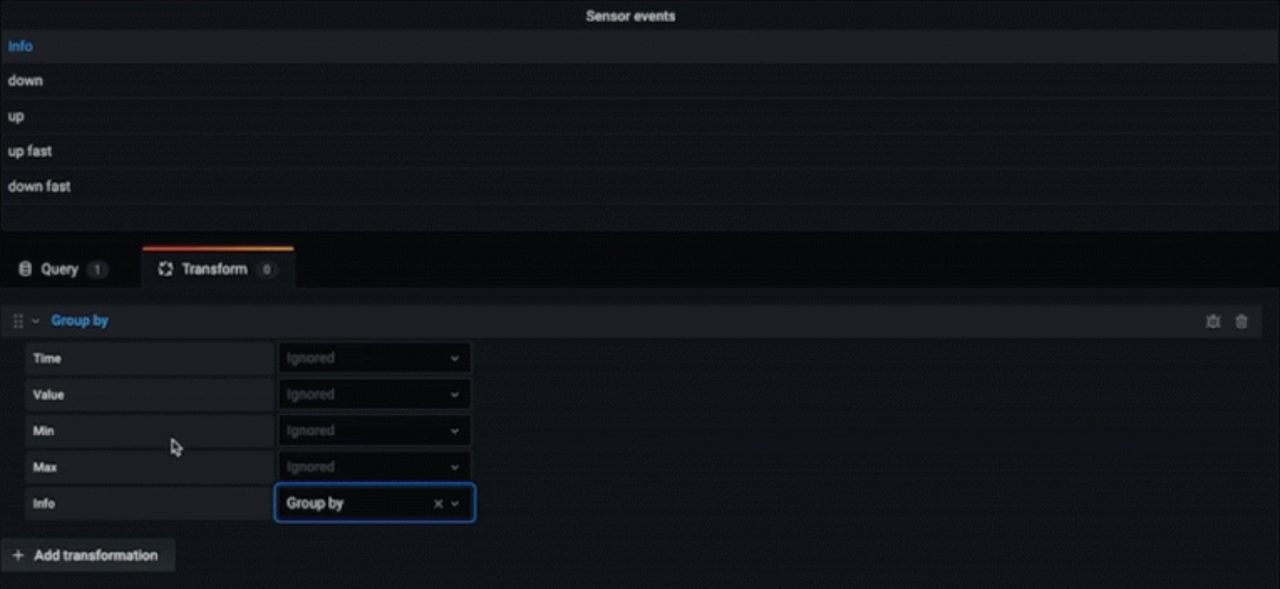
Transformations
Transformations allow you to rename, summarize, combine, and perform calculations across different queries and data sources.
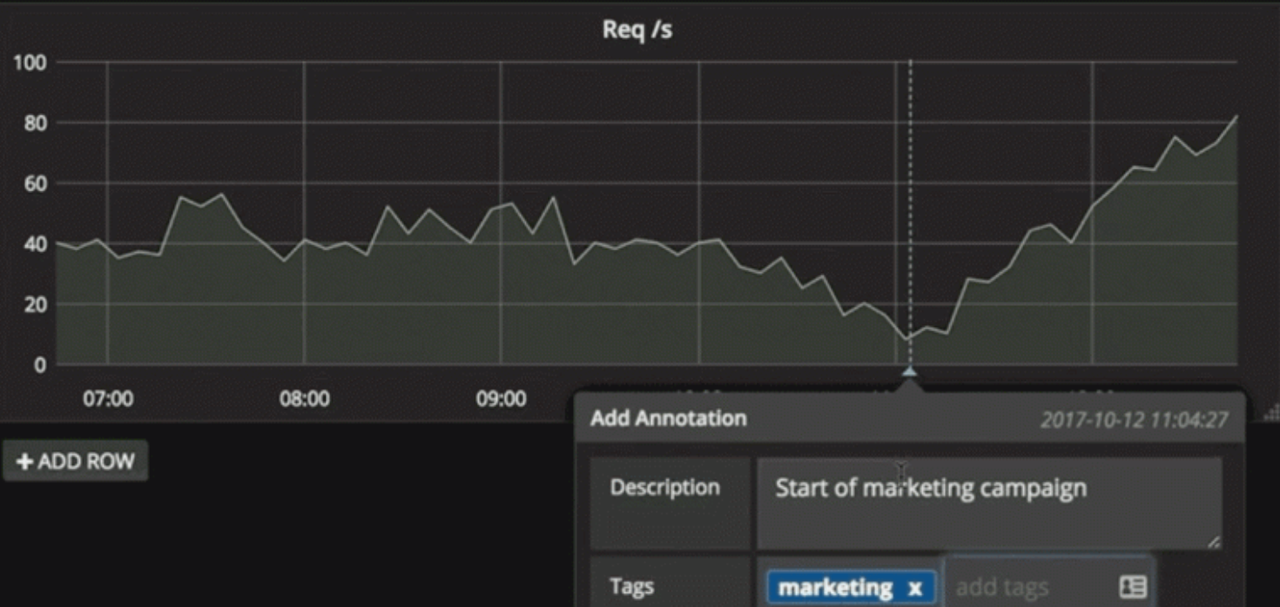
Annotations
Annotate graphs with rich events from different data sources. Hover over events shows you the full event metadata and tags.
5. Use Cases
5.1 Application Performance Monitoring
Development teams use Grafana to create comprehensive APM dashboards tracking response times, error rates, throughput, and user experience metrics across microservices architectures.
5.2 Infrastructure and System Monitoring
Operations teams leverage Grafana for monitoring server performance, network health, storage utilization, and cloud resource consumption with real-time alerting.
5.3 Business Intelligence and KPI Tracking
Product and business teams utilize Grafana to visualize business metrics, user engagement, revenue tracking, and operational KPIs alongside technical metrics.
5.4 Security and Compliance Monitoring
Security teams implement Grafana dashboards for SIEM data visualization, threat detection, audit trail monitoring, and compliance reporting.
6. Practical Example
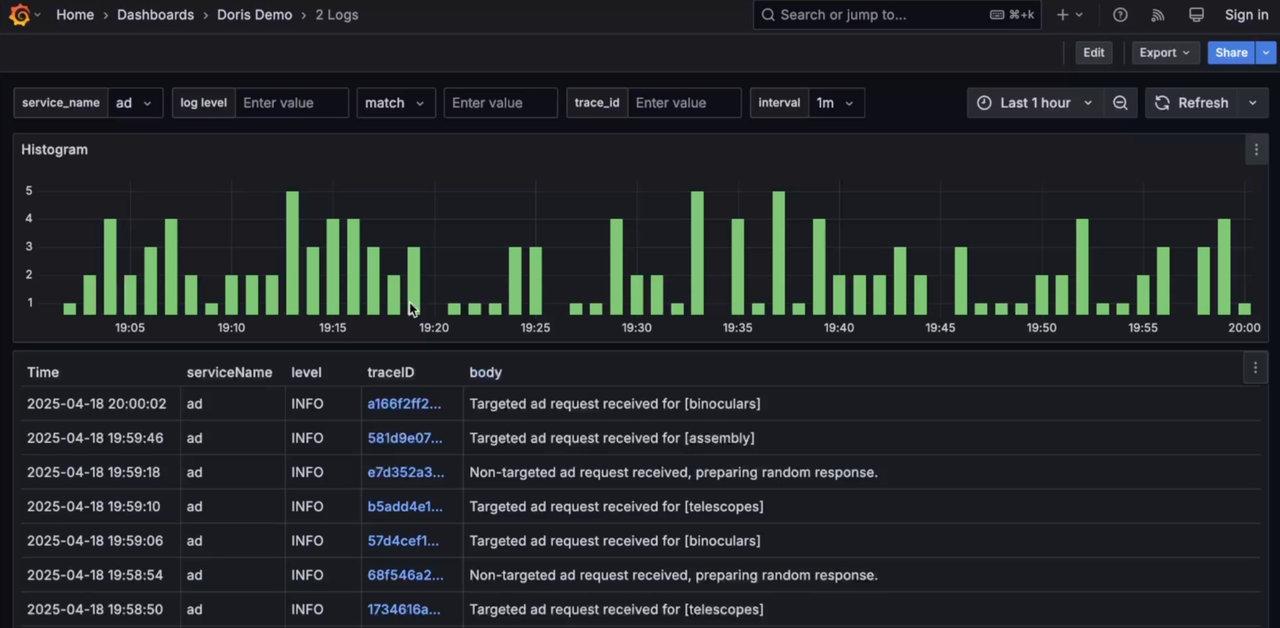
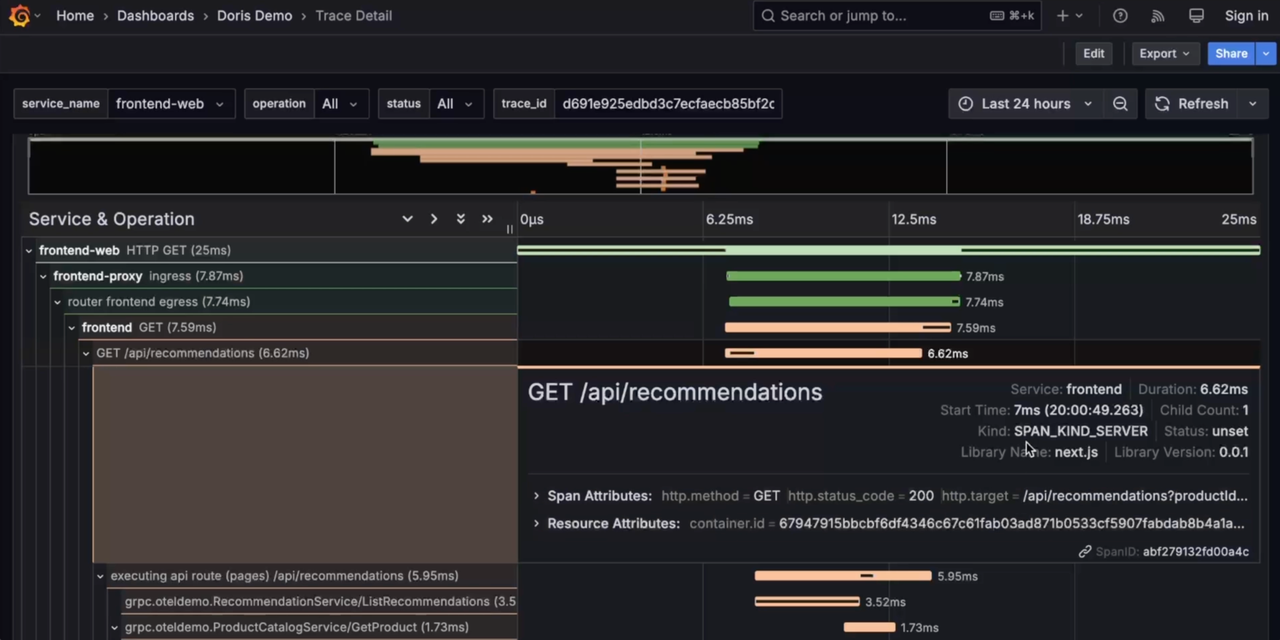
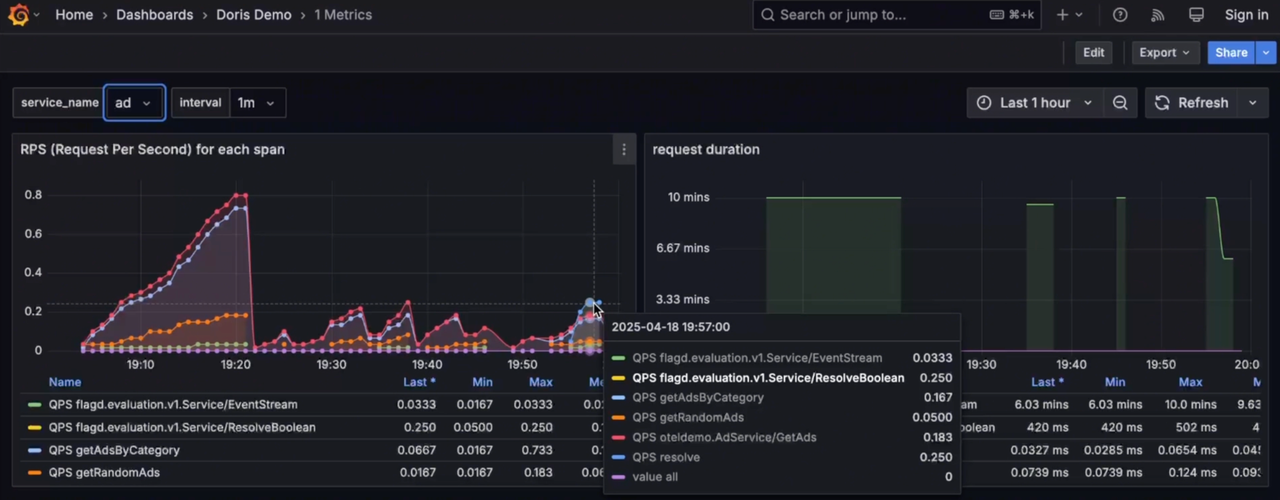
We demonstrate the VeloDB-based observability platform using a comprehensive demo from the OpenTelemetry community.
The observed business system simulates a demo e-commerce website composed of frontend, authentication, cart, payment, logistics, advertising, recommendation, risk control, and more than ten modules, reflecting a high level of system complexity, thus presenting significant challenges for observability data collection, storage, and analysis.
The Load Generator tool sends continuous requests to the entry service, generating vast volumes of observability data (Logs, Traces, Metrics). These data are collected using OpenTelemetry SDKs in various languages, sent to the OpenTelemetry Collector, preprocessed by Processors, and finally written into VeloDB via the OpenTelemetry Doris Exporter. Observability visualization tools such as Grafana connects to VeloDB through the MySQL interface, providing visualized query and analysis capabilities.
Grafana connects to VeloDB via MySQL datasource, offering unified visualization and analysis of Logs, Traces, and Metrics, including cross-analysis between Logs and Traces.
# grafana/provisioning/datasources/default.yaml

apiVersion: 1

datasources:
  - name: Doris
    uid: doris
    type: mysql
    url: doris:9030
    user: admin
    editable: true
    isDefault: true
    jsonData:
      database: otel
      timezone: Asia/Shanghai
-
Log
-
Trace
-
Metrics
7. Key Takeaways
- Grafana provides unified observability by connecting to 150+ data sources without vendor lock-in, enabling comprehensive monitoring across diverse infrastructure
- Flexible visualization capabilities support custom dashboards tailored to specific teams, use cases, and business requirements with real-time updates
- Modern features in Grafana 12 include observability as code, AI-powered anomaly detection, and enhanced collaboration tools for enterprise teams
- Open source foundation offers cost-effective monitoring solutions with extensive community support and plugin ecosystem
- Enterprise-ready architecture provides high availability, authentication, RBAC, and scalability for large-scale deployments
8. FAQ
Q: What's the difference between Grafana OSS and Grafana Enterprise?
A: Grafana OSS is free and open-source with core features, while Grafana Enterprise adds advanced security, reporting, team management, and priority support.
Q: Can Grafana replace other monitoring tools completely?
A: Grafana excels at visualization and alerting but typically works alongside data collection tools like Prometheus, rather than replacing entire monitoring stacks.
Q: How does Grafana handle high availability and scaling?
A: Grafana supports clustering, load balancing, and database backends like PostgreSQL or MySQL for high availability deployments.
Q: What's the learning curve for creating effective Grafana dashboards?
A: Basic dashboards can be created quickly, but advanced features like templating, alerting, and custom plugins require deeper knowledge of data sources and visualization principles.
9. Additional Resources & Next Steps
Learn More
- Grafana documentation
- Grafana Introduction
- Get started with Grafana and Prometheus
- Grafana Data Sources
- Grafana MySQL Data Source (compitable with Apache Doris and VeloDB)
- Grafana Panels and Visualizations
- Grafana Dashboards
- Grafana Alerting
- Grafana University Training
Related Articles
- What’s new in the Infinity data source for Grafana
- AI in observability at Grafana Labs: Making observability easy and accessible for everyone
- LLM-powered insights into your tracing data: introducing MCP support in Grafana Cloud Traces
- Building on the foundation of OpenTelemetry eBPF Instrumentation: what’s new in Grafana Beyla 2.5
- How should Prometheus handle OpenTelemetry resource attributes?How should Prometheus handle OpenTelemetry resource attributes?
- How to monitor your homelab with Beyla, eBPF, and OpenTelemetry
- Introducing the Causely data source plugin for Grafana
- Industrial IoT visualization: How Grafana powers industrial automation and IIoT
Vidoes
- Getting Started with Grafana Play - Learn, Explore, and Play with Grafana
- How to Install Grafana on Every OS | Grafana
- Open Source Observability Explained - The Grafana Stack
- Understanding Dashboards in Grafana | Panels, Visualizations, Queries, and Transformations
- Deep Dive - Table Panel Visualizations: What Are They? How to Get Started? | Grafana
- How to Display Grafana Alerts to Your Dashboards | Grafana
- Getting Started with Grafana Cloud's AI Assistant for Observability
- How to Use the Logs Drilldown App (Previously Explore Logs) for Grafana
Get Started
Ready to implement comprehensive observability with Grafana? Start with our quickstart guide and begin creating dashboards that transform your monitoring data into actionable insights.
Visualize Your Data: Deploy Grafana today and unlock the power of unified observability across your entire technology stack with beautiful, actionable dashboards.