Honestly, every time I check performance benchmarks, my eyes instinctively dart to see where Apache Doris ranks.
Opening JSONBench's leaderboard this time, I felt that familiar mix of anticipation and nervousness.
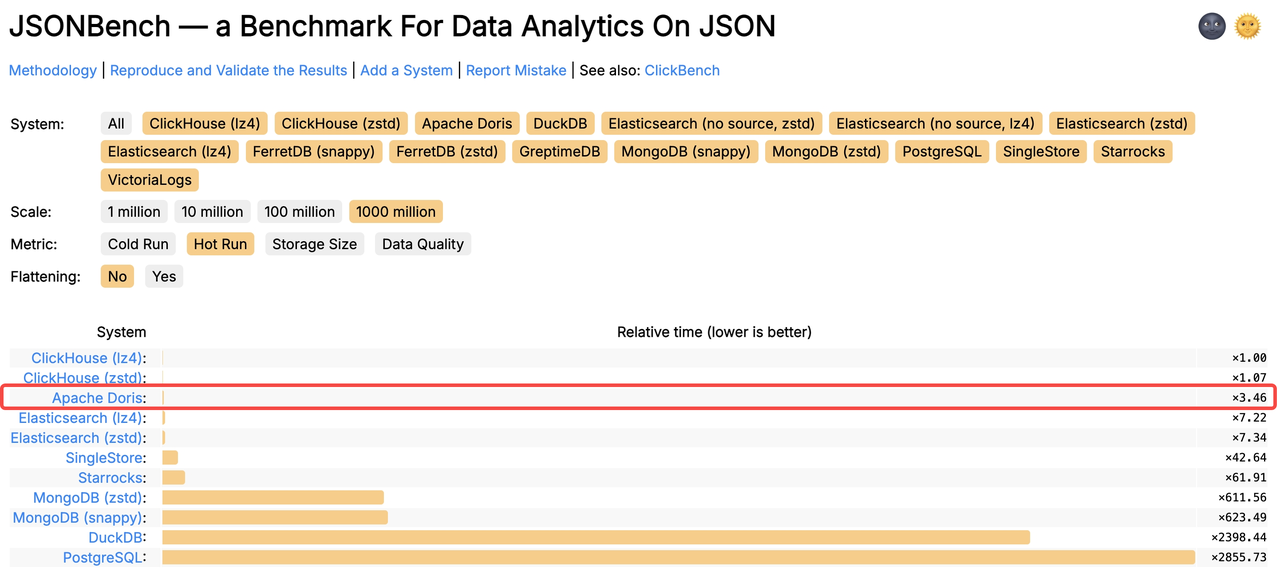
Fortunately, the result brought me a sigh of relief: Apache Doris snagged third place with just its default configuration, trailing only two versions of ClickHouse (the maintainer of JSONBench itself).
Not bad. But can Apache Doris go even further? I wanted to see how much more we could cut query latency through optimization, and find out the true performance gap between Apache Doris and ClickHouse.
Long story short, here's a before-and-after comparison chart of our optimizations. For the details behind the improvements, read on!
-
Ranking with default configuration
-
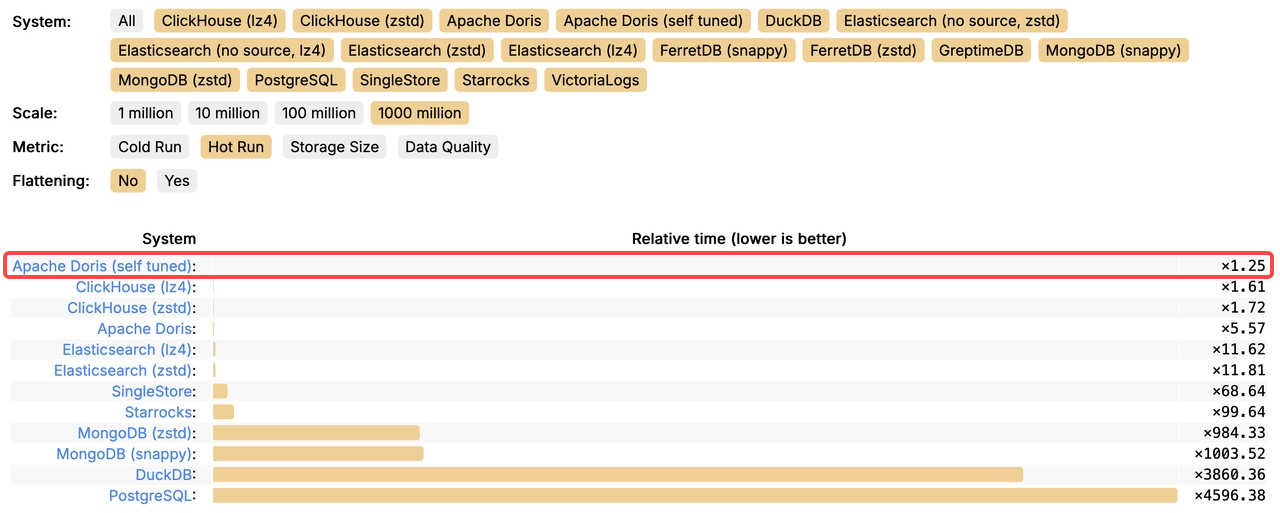
Ranking after optimization
What is JSONBench
JSONBench is a benchmark for data analytics on JSON. Specifically, it features 1 billion JSON data records sourced from real-world production environments, along with 5 SQL queries specifically crafted to test JSON structures. The goal is to compare how well different database systems handle semi-structured data.
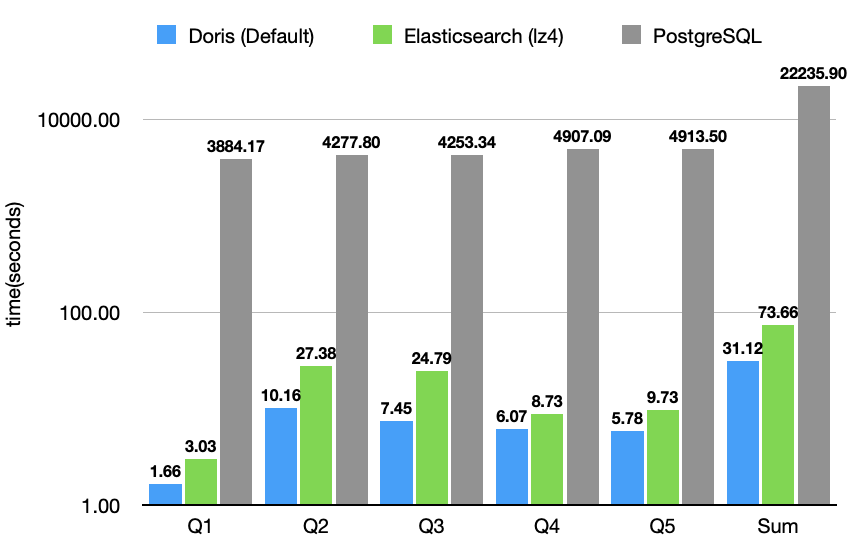
Currently, the leaderboard includes well-known database systems like ClickHouse, SingleStore, MongoDB, Elasticsearch, DuckDB, and PostgreSQL. As of now, Apache Doris delivers 2x the performance of Elasticsearch and an impressive 80x the performance of PostgreSQL.
JSONBench official website: jsonbench.com
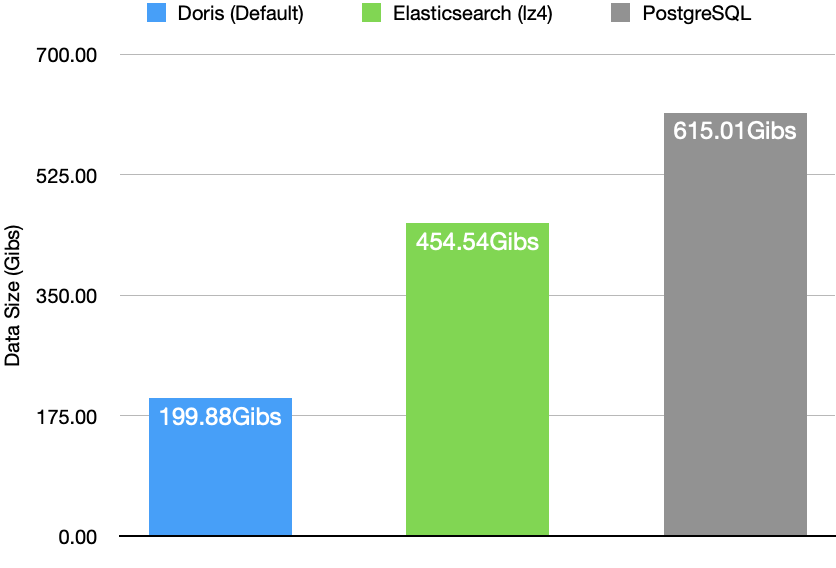
Not only does Apache Doris outperform its competitors in terms of performance, but it also uses just 50% of the storage of Elasticsearch and 1/3 that of PostgreSQL on the same dataset.
The JSONBench testing process involves several key steps:
First, a table named Bluesky is created in the database, and 1 billion real user behavior logs are imported into it. During the test, each query is executed 3 times. Before each query, the operating system's Page Cache is cleared to simulate both cold and warm query scenarios. Finally, database performance rankings are determined based on the overall execution times of the queries.
In this test, Apache Doris used the VARIANT data type to store JSON data. The default table schema is as follows:
CREATE TABLE bluesky (
    `id` BIGINT NOT NULL AUTO_INCREMENT,
    `data` variant NOT NULL
)
DISTRIBUTED BY HASH(id) BUCKETS 32
PROPERTIES ("replication_num"="1");
The VARIANT data type, introduced in Apache Doris 2.1, is designed for storing semi-structured JSON data. It allows you to store complex data structures containing various data types ( such as integers, strings, Booleans,and more) withoutthe need to pre-define specific columns in your table schema.
The VARIANT type is especially well-suited for handling complex, nested structures that might change frequently. During the write process, this type can automatically infer column information based on the structure and type of the incoming data, dynamically merging the write schema. It achieves this by storing JSON keys and their corresponding values as columns and dynamic sub-columns.
- More about the VARIANT data type in Apache Doris
How we fine-tune it
The JSONBench rankings are based on the performance data of each database system under its default configuration. So, the question is, for even better performance in real production environments, can we further unlock the potential of Apache Doris through tuning?
01 Environment configuration
- Server: AWS M6i.8xlarge(32C128)
- OS: Ubuntu24.04
- Apache Doris: v3.0.5
02 Schema structuring
Since the JSON data accessed in JSONBench's specific queries uses fixed extraction paths, the schema of the semi-structured data is effectively fixed. This allows us to leverage generated columns to extract frequently used fields. In this way, we combine the benefits of semi-structured and structured data. The same idea applies to frequently accessed JSON paths or calculated expressions. You can just add generated columns to speed up queries!
CREATE TABLE bluesky (
    kind VARCHAR(100) GENERATED ALWAYS AS (get_json_string(data, '$.kind')) NOT NULL,
    operation VARCHAR(100) GENERATED ALWAYS AS (get_json_string(data, '$.commit.operation')) NULL,
    collection VARCHAR(100) GENERATED ALWAYS AS (get_json_string(data, '$.commit.collection')) NULL,
    did VARCHAR(100) GENERATED ALWAYS AS (get_json_string(data,'$.did')) NOT NULL,
    time DATETIME GENERATED ALWAYS AS (from_microsecond(get_json_bigint(data, '$.time_us'))) NOT NULL,
    `data` variant NOT NULL
)
DUPLICATE KEY (kind, operation, collection)
DISTRIBUTED BY HASH(collection, did) BUCKETS 32
PROPERTIES ("replication_num"="1");
Besides reducing the overhead of data extraction during queries, these flattened columns can also be used as partitioning columns to enable a more balanced data distribution.
Please note that the SQL query statements must also be updated to use the flattened columns:
// JSONBench original queries:
SELECT cast(data['commit']['collection'] AS TEXT ) AS event, COUNT(*) AS count FROM bluesky GROUP BY event ORDER BY count DESC;
SELECT cast(data['commit']['collection'] AS TEXT ) AS event, COUNT(*) AS count, COUNT(DISTINCT cast(data['did'] AS TEXT )) AS users FROM bluesky WHERE cast(data['kind'] AS TEXT ) = 'commit' AND cast(data['commit']['operation'] AS TEXT ) = 'create' GROUP BY event ORDER BY count DESC;
SELECT cast(data['commit']['collection'] AS TEXT ) AS event, HOUR(from_microsecond(CAST(data['time_us'] AS BIGINT))) AS hour_of_day, COUNT(*) AS count FROM bluesky WHERE cast(data['kind'] AS TEXT ) = 'commit' AND cast(data['commit']['operation'] AS TEXT ) = 'create' AND cast(data['commit']['collection'] AS TEXT ) IN ('app.bsky.feed.post', 'app.bsky.feed.repost', 'app.bsky.feed.like') GROUP BY event, hour_of_day ORDER BY hour_of_day, event;
SELECT cast(data['did'] AS TEXT ) AS user_id, MIN(from_microsecond(CAST(data['time_us'] AS BIGINT))) AS first_post_ts FROM bluesky WHERE cast(data['kind'] AS TEXT ) = 'commit' AND cast(data['commit']['operation'] AS TEXT ) = 'create' AND cast(data['commit']['collection'] AS TEXT ) = 'app.bsky.feed.post' GROUP BY user_id ORDER BY first_post_ts ASC LIMIT 3;
SELECT cast(data['did'] AS TEXT ) AS user_id, MILLISECONDS_DIFF(MAX(from_microsecond(CAST(data['time_us'] AS BIGINT))),MIN(from_microsecond(CAST(data['time_us'] AS BIGINT)))) AS activity_span FROM bluesky WHERE cast(data['kind'] AS TEXT ) = 'commit' AND cast(data['commit']['operation'] AS TEXT ) = 'create' AND cast(data['commit']['collection'] AS TEXT ) = 'app.bsky.feed.post' GROUP BY user_id ORDER BY activity_span DESC LIMIT 3;

// Flattened columns queries:
SELECT collection AS event, COUNT(*) AS count FROM bluesky GROUP BY event ORDER BY count DESC;
SELECT collection AS event, COUNT(*) AS count, COUNT(DISTINCT did) AS users FROM bluesky WHERE kind = 'commit' AND operation = 'create' GROUP BY event ORDER BY count DESC;
SELECT collection AS event, HOUR(time) AS hour_of_day, COUNT(*) AS count FROM bluesky WHERE kind = 'commit' AND operation = 'create' AND collection IN ('app.bsky.feed.post', 'app.bsky.feed.repost', 'app.bsky.feed.like') GROUP BY event, hour_of_day ORDER BY hour_of_day, event;
SELECT did AS user_id, MIN(time) AS first_post_ts FROM bluesky WHERE kind = 'commit' AND operation = 'create' AND collection = 'app.bsky.feed.post' GROUP BY user_id ORDER BY first_post_ts ASC LIMIT 3;
SELECT did AS user_id, MILLISECONDS_DIFF(MAX(time),MIN(time)) AS activity_span FROM bluesky WHERE kind = 'commit' AND operation = 'create' AND collection = 'app.bsky.feed.post' GROUP BY user_id ORDER BY activity_span DESC LIMIT 3;
03 Page Cache tuning
After adjusting the query statements, we enabled profile and executed the complete query test:
set enable_profile=true;
Then, by visiting the FE web UI (port 8030) and reviewing the profile, we noticed that the Page Cache hit rate was low in the SCAN Operator. This meant that during our hot-read test, some cold reads were still happening, like trying to grab something from the fridge and realizing it’s not there, so you have to go all the way to the grocery store.
-  CachedPagesNum:  1.258K  (1258)
-  TotalPagesNum:  7.422K  (7422)
This usually happens because the Page Cache isn’t large enough to hold all the data from the Bluesky table. To fix this, we recommend adding this setting in be.conf: storage_page_cache_limit=60%
This increases the Page Cache size from the default 20% of total memory to 60%.
After rerunning the test, we saw that the cold read issue was resolved.
-  CachedPagesNum:  7.316K  (7316)
-  TotalPagesNum:  7.316K  (7316)
04 Maximizing parallelism
To further unleash Doris's performance potential, we set the session variable parallel_pipeline_task_num to 32. Since the benchmark was run on an m6i.8xlarge machine with 32 CPU cores, matching the parallelism to the number of cores helps maximize CPU utilization.
// Parallelism of a single Fragment
set global parallel_pipeline_task_num=32;
Optimization results
After the aforementioned adjustments to parameters such as schema,query, memory limits, and CPU, we compared the performance of Apache Doris before and after optimization, along with results from other database systems. The findings are as follows:
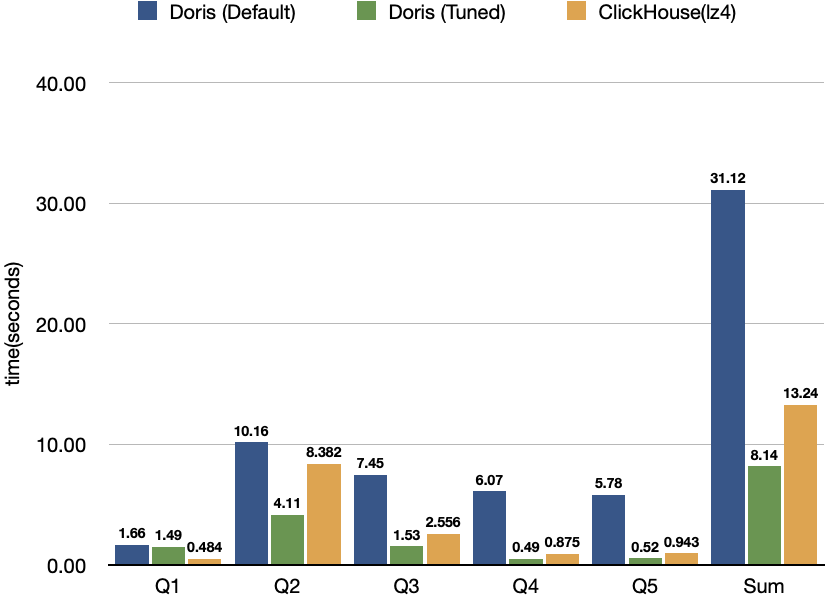
Compared to pre-optimization, Apache Doris reduced overall query time by 74%. It also outperformed the previous leaderboard leader, ClickHouse, by 39%.
Summary and outlook
Through schema structuring, query statement optimization, cache configuration adjustment, and parallelism parameter settings, Apache Doris significantly cuts query latency.
Under default settings, Apache Doris trails ClickHouse by a few seconds on querying 1 billion JSON records. However, thanks to Doris’ strong JSON processing, VARIANT data type support, and generated columns, tuning can significantly improve its performance on semi-structured data. After optimization, Doris clearly leads other similar databases in this area.
Looking ahead, Apache Doris will keep refining its capabilities for semi-structured data, aiming to deliver more powerful and efficient analytics by:
- Optimizing storage for sparse VARIANT columns, supporting over 10,000 sub-columns
- Reducing memory usage of wide tables with tens of thousands of columns
- Supporting custom types and indexes for VARIANT sub-columns based on column name patterns
Join the discussion in the Apache Doris Community!